Issue Details page
A detected issue has many aspects that need consideration. Nanitor helps you mitigate potential security risks both by prioritizing issues and by providing the necessary context needed to understand the issue and do due diligence. Nanitor keeps track of the complete history of the issue, and comments can be added on a given issue to pass information to other stakeholders.
Header
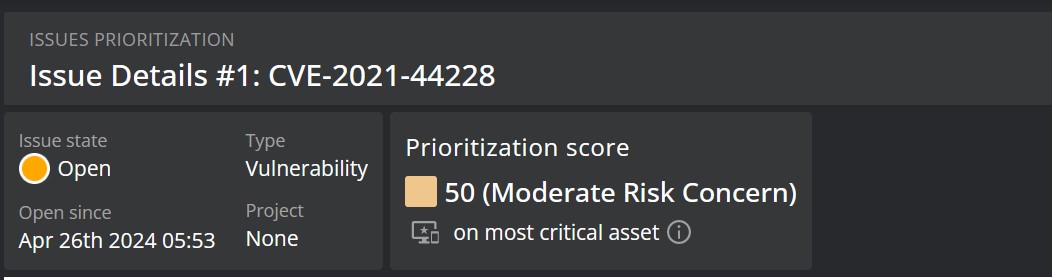
In the header of the issue detail view, you will get basic information about the detected issue, such as:
| Property | Description | Options |
|---|---|---|
| State | Issue state | Open, Closed, Excluded |
| Open since | Date and time since the issue was last discovered | |
| Issue type | The category the issue falls into | Vulnerability, Misconfiguration, Patch, Identity, Software, PII, or Device |
| Project | The remediation project(s) an issue has been assigned to | |
| Prioritization score | The issue's Nanitor Prioritization Score (NPS). | Critical Impact Threat, High Urgency risk, and Moderate Risk Concern |
| Most critical asset priority | Click the information icon near the label to see a tooltip showing which assets on which the issue has been detected have the highest confidentiality (C), integrity (I) and availability (A) scores. These values are used in the calculation of the issue's NPS. |
Overview tab
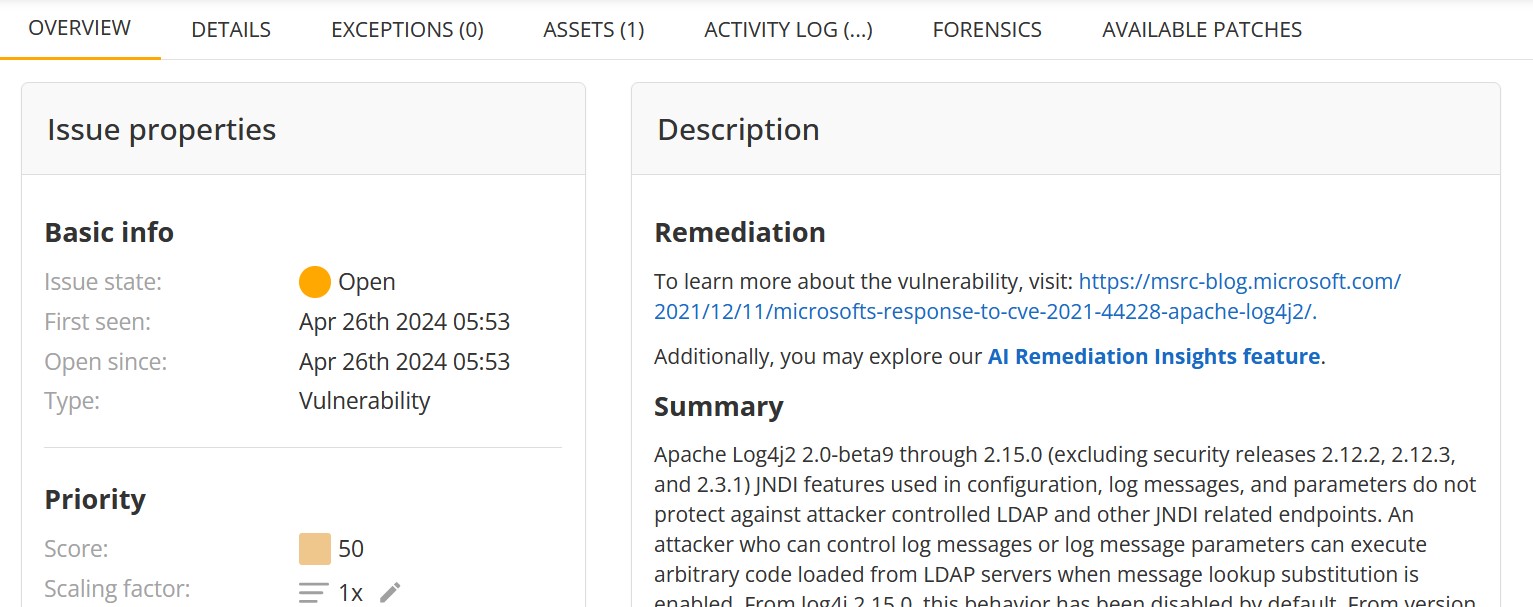
The Overview tab contains the main information regarding an issue. For more detailed information, open the corresponding tab.
The Overview tab contains the following sections:
- Issue properties:
- Basic info: The issue state, open since date and time, first seen date and time, and issue type.
- Priority: The issue prioritization score, priority scaling factor and issue priority in terms of confidentiality (C), integrity (I) and availability (A). By default, each issue has a priority scaling factor of 1. The scaling factor is an indicator of how important you rate a specific type of detected issue. The priority scaling factor can be overwritten for a single issue if needed or desired.
- Jira: A link to the ticket in Jira, if available.
- Health score impact: Information on how fixing the issue will impact the organization's overall health and health for the specific issue type (for example, vulnerability health or identity health).
- External / Industry standards: For some types of issues, such as Vulnerability issues, this section displays information on whether the issue belongs to the CISA Known Exploited Vulnerabilities Catalog and is considered ransomware, as well as its EPSS score and CVSS vectors. It also includes the list of compliance frameworks affected by this issue.
- Project: The list of projects to which the issue is assigned.
- Issue description: Short issue description.
- Assets affected: General information on the number of assets affected by the issue, as well as OS and labels of these assets. For vulnerability issues, this section includes a Vulnerable Software box — see below.
- AI remediation insights: AI-powered suggestions for remediating the detected issue. See AI Remediation Insights below for details.
- AI root cause analysis: AI-powered analysis that classifies the issue and identifies its root cause, impact, and recommended actions. Available for vulnerability, misconfiguration, patch, and software policy issues. See AI Root Cause Analysis below for details.
- Comments: Comments, if any.
Vulnerable Software (Vulnerability issues only)
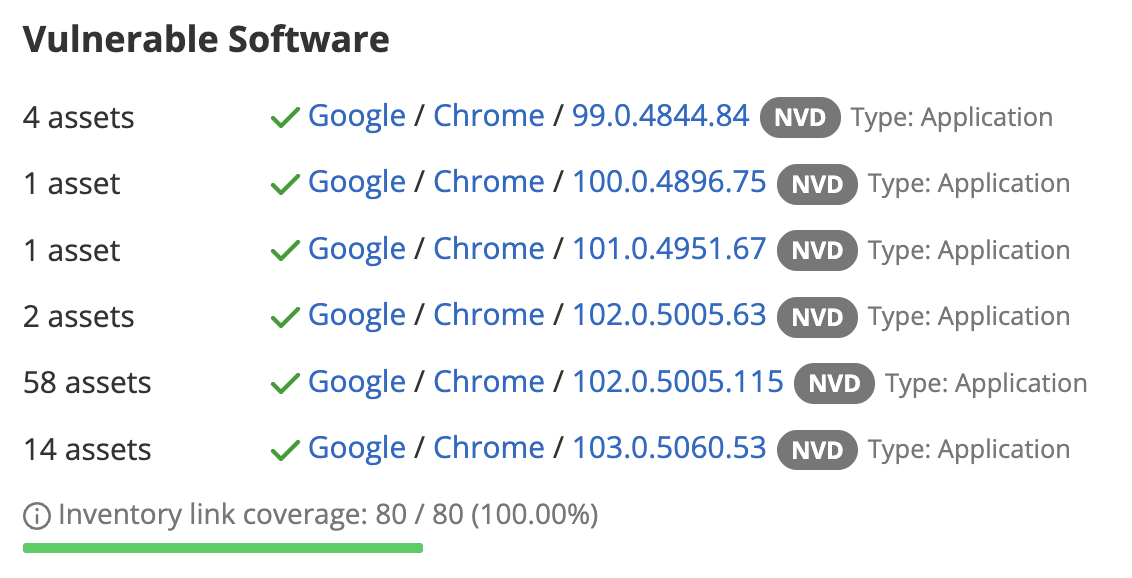
For vulnerability issues, the Vulnerable Software section in the Assets affected box shows which software was detected as vulnerable and whether it is linked to an item in your software inventory.
Nanitor detects vulnerabilities through two pipelines: OVAL scans evaluate machine data directly (registry keys, file paths, installed packages), while NVD/CPE matching correlates your software inventory against the National Vulnerability Database. Because these pipelines work differently, a detection may not always map back to a specific software inventory entry.
Each entry shows the number of affected devices, detection details, and link status:
- A green checkmark for linked detections — the vulnerability is matched to a specific item in your software inventory, showing the vendor, product, and version with a link to the inventory entry.
- A yellow warning for unlinked detections — the scanner identified something as vulnerable but could not match it to a software inventory item. Depending on available data, the entry may show forensic software details, a CPE vector, or "(Unmatched)" if no software information could be determined. Hover over the tooltip for an explanation of why the detection is unlinked. This can happen when Nanitor's vulnerability database has no record of the detected product, when the device's software inventory has no corresponding item even though the product is recognized, or when the vulnerability is detected through a registry or file check that does not correspond to a specific software package tracked in your inventory. The vulnerability is still real and should still be addressed.
- A detection source badge (OVAL, NVD) indicating how the vulnerability was identified. Some entries may show multiple badges if the vulnerability was detected through more than one method.
- A software type label (Type: OS or Type: Application) distinguishing OS-level from application-level vulnerabilities.
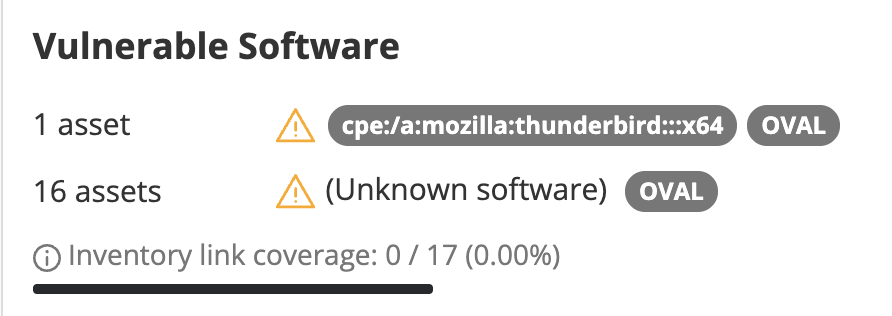
Below the entries, an Inventory link coverage progress bar shows how many affected devices have a linked software item (e.g., "80 / 80 devices — 100%").
If you notice missing or unexpected results, contact Nanitor Support so we can investigate and improve matching coverage.
Details
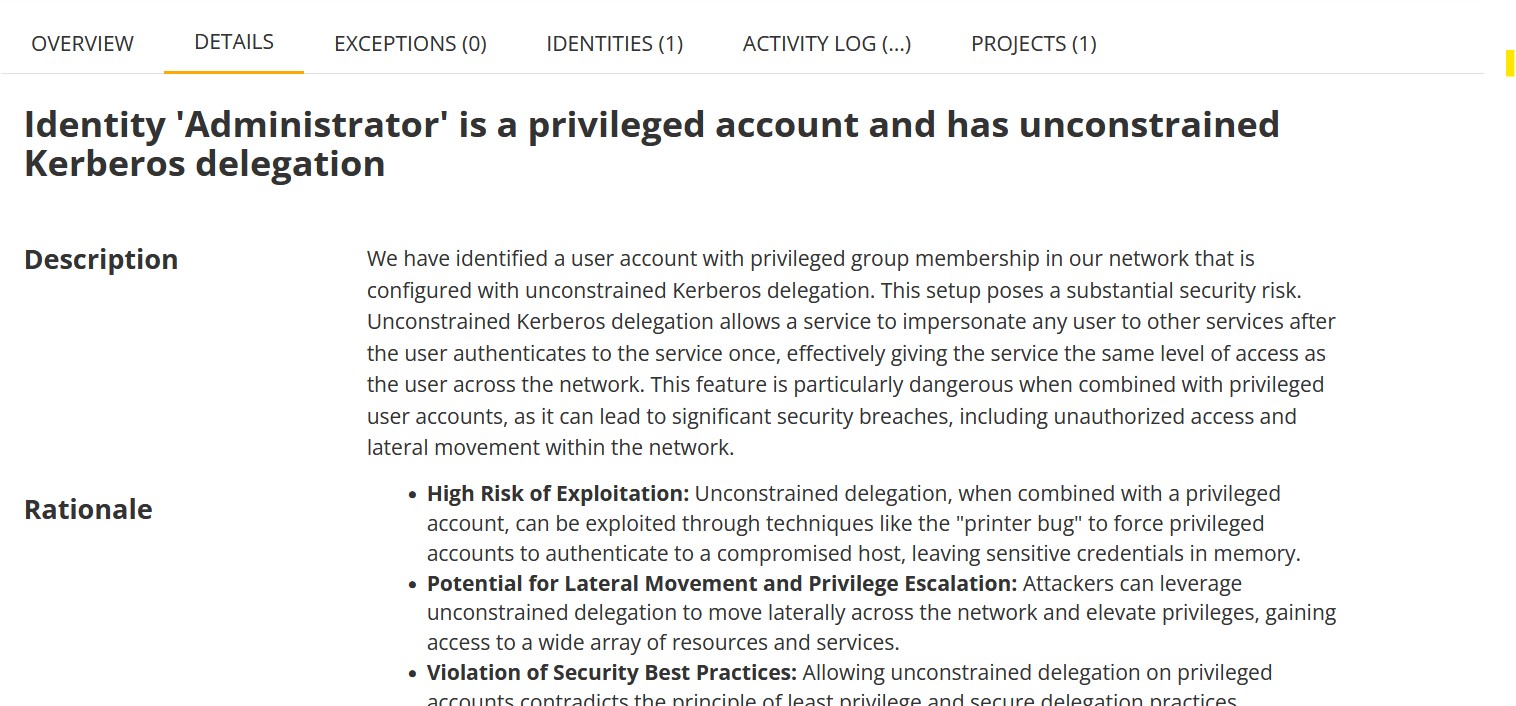
This tab displays details on the detected issue including its technical details, external links, if any, and remediation suggestions.
Exceptions
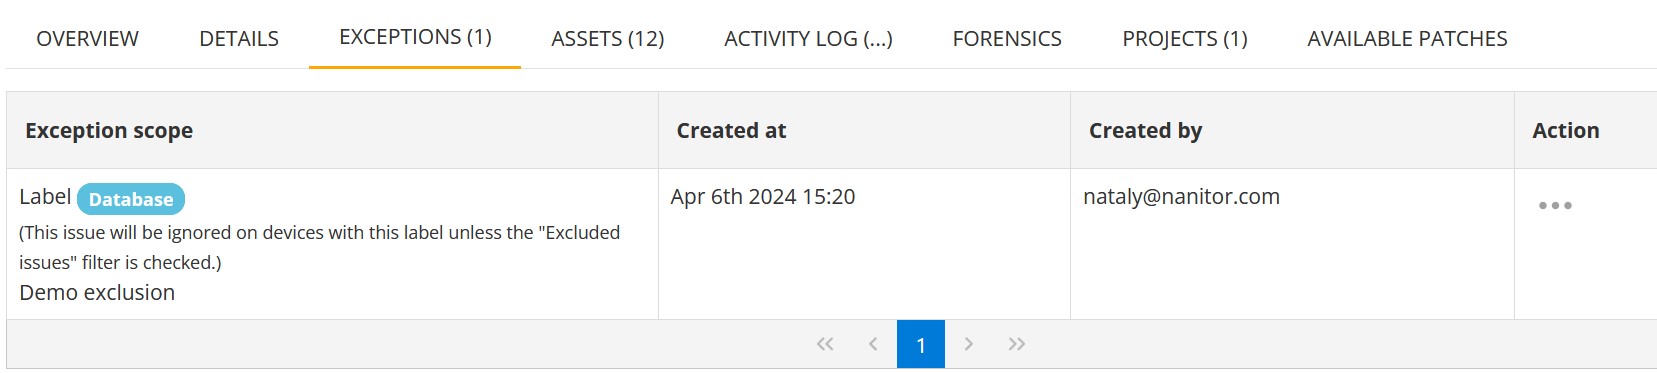
The Exceptions tab lists the exclusions made for the issue. This table includes the following columns for each exception in the list:
| Column | Description |
|---|---|
| Exception scope | The labels of the assets on which the issue will be ignored. It also contains the explanation provided when the exception was created. |
| Created at | The date and time of the exception creation. |
| Created by | The nanitor user who has created the exception. |
| Action | Possibility to remove the exception. |
Forensics

This tab provides further information helpful for remediation purposes to identify exactly what Nanitor has detected and where. For vulnerabilities, the forensics tab is grouped by assets where the vulnerability has the same root cause. For Identity issues, the forensics tab provides information on the UI location of the detected issues for easier remediation
Patch issues
For patch issues detected through the operating system's own update query, the Forensics tab shows a Windows Update / OS Query Detection table. This section describes what each field means and how to verify a result directly on the device.
| Field | Description |
|---|---|
| Update Title | The full title of the update. Shown only when available. |
| MSRC Severity | The Microsoft Security Response Center severity that Windows Update reported for the update on this device. Shown only when available. |
| Detection Source | Where the missing patch was reported from, for example SCCM update records. When no source was recorded, this shows the shell that the reproduce command runs in: PowerShell on Windows and Terminal Shell on macOS and Linux. |
| OS | The operating system of the affected device. |
| First Detected Missing | The date on which Nanitor first found the patch missing on the device. Shown only when available. |
| Vulnerability Scan | Either Confirmed missing or Not confirmed by vulnerability scan. This row is not shown for issues whose forensics data was recorded by an older Nanitor version. |
Stale patch warning
Nanitor compares the operating system's report with the result of its own vulnerability scan, which is based on OVAL definitions:
- A yellow warning means that the operating system reported the patch, but the vulnerability scan has not independently confirmed it as missing. The entry may be stale, for example a leftover Windows Update or WSUS record. Verify the result on the device with the command described below. If the update is not offered there either, the entry may be a leftover in the WSUS data.
- An information message means that the vulnerability scan independently confirmed the patch as missing on the device.
- No message is shown for issues whose forensics data was recorded by an older Nanitor version.
Verifying a missing patch on the device
Below the table, the Reproduce command shows a command that you can run on the device to list the updates that the operating system reports as missing. Patch issues detected before the upgrade to Nanitor 7.2.0 keep the earlier forensics data and command.
For updates reported by Windows Update or WSUS, the command is:
$s = (New-Object -ComObject Microsoft.Update.Session).CreateUpdateSearcher(); $s.Online = $false; $s.Search("IsInstalled=0 and Type='Software' and IsHidden=0").Updates | Format-Table Title, MsrcSeverity
The command sets Online = $false, so it queries the update data cached on the device instead of contacting an update server. This also makes it work on devices that are managed through WSUS and are blocked from reaching Windows Update directly. Because the cached data is only as current as the last update scan, start a new update scan on the device before you run the command.
For updates whose Detection Source is SCCM update records, the command queries the SCCM client instead:
Get-WmiObject -Namespace root\ccm\clientSDK -Class CCM_SoftwareUpdate | Select-Object Name, ArticleID, EvaluationState | Format-Table
Run this command in Windows PowerShell 5.1 as an administrator. In PowerShell 7, use the equivalent Get-CimInstance command, which lists the same updates and columns:
Get-CimInstance -Namespace root\ccm\clientSDK -ClassName CCM_SoftwareUpdate | Select-Object Name, ArticleID, EvaluationState | Format-Table
For macOS and Linux devices, run the command that matches the operating system in a terminal on the device:
- macOS:
sudo softwareupdate -l - Debian and Ubuntu: run
sudo apt-get updatefirst so the package lists are current, thensudo apt-get -s dist-upgrade | grep Inst | grep security - RHEL and CentOS:
sudo yum updateinfo list updates security
Other Linux distributions do not show a reproduce command.
Available Patches
For vulnerability issues affecting Windows systems, the Available Patches tab provides detailed guidance on available vendor patches. Patches are grouped by the specific operating system version (e.g., "Microsoft Windows Server 2016 Datacenter 14393") to ensure you see only relevant patches for the assets in your environment.
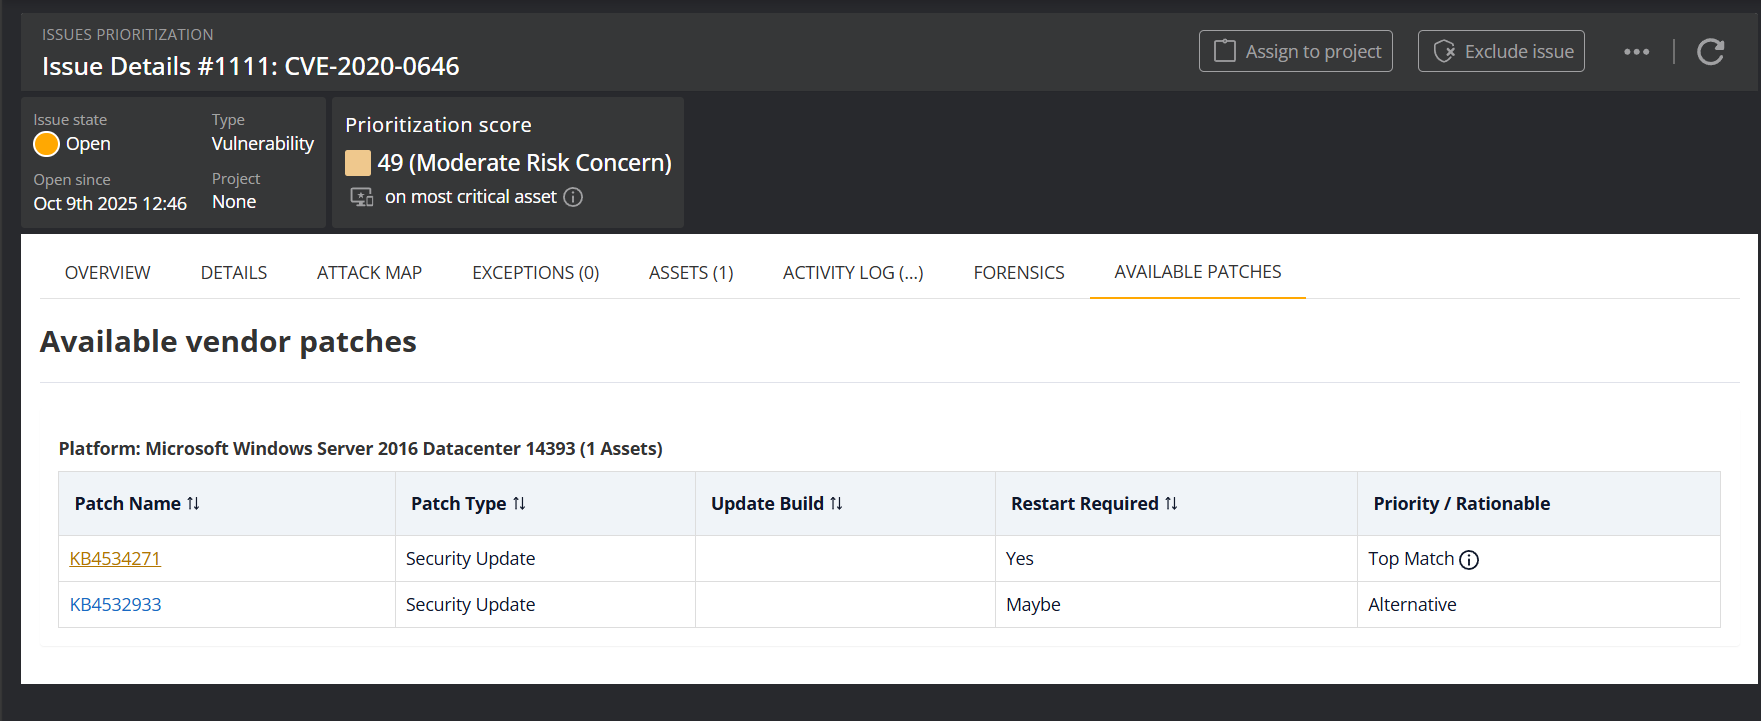
The table displays the following information for each patch:
| Column | Description |
|---|---|
| Patch Name | The KB article number, linked to Microsoft's documentation |
| Patch Type | The type of update (e.g., Security Update, Security Hotpatch, Cumulative Update) |
| Update Build | The Windows build number after applying this patch |
| Restart Required | Whether a system restart is needed (Yes, No, or Maybe) |
| Priority / Rationale | Indicates the recommended patch with "Top Match" label |
Top Match Prioritization
The "Top Match" label indicates the recommended patch for each OS group. Hover over the info icon to see the prioritization rationale, which considers:
- Supersedence: Newer patches that replace older ones are prioritized
- Patch Type: More comprehensive patch types are preferred (e.g., Hotpatch > Cumulative Update > Security Only)
- KB Number: As a tie-breaker, patches with higher numbers are selected
This automated recommendation is based on public vendor data. Always consider your organization's specific testing and deployment policies before applying updates.
Inventory lists
The inventory lists provide detailed information about the inventory related to the issue. Each list is accessible by clicking on the corresponding tab.
Assets
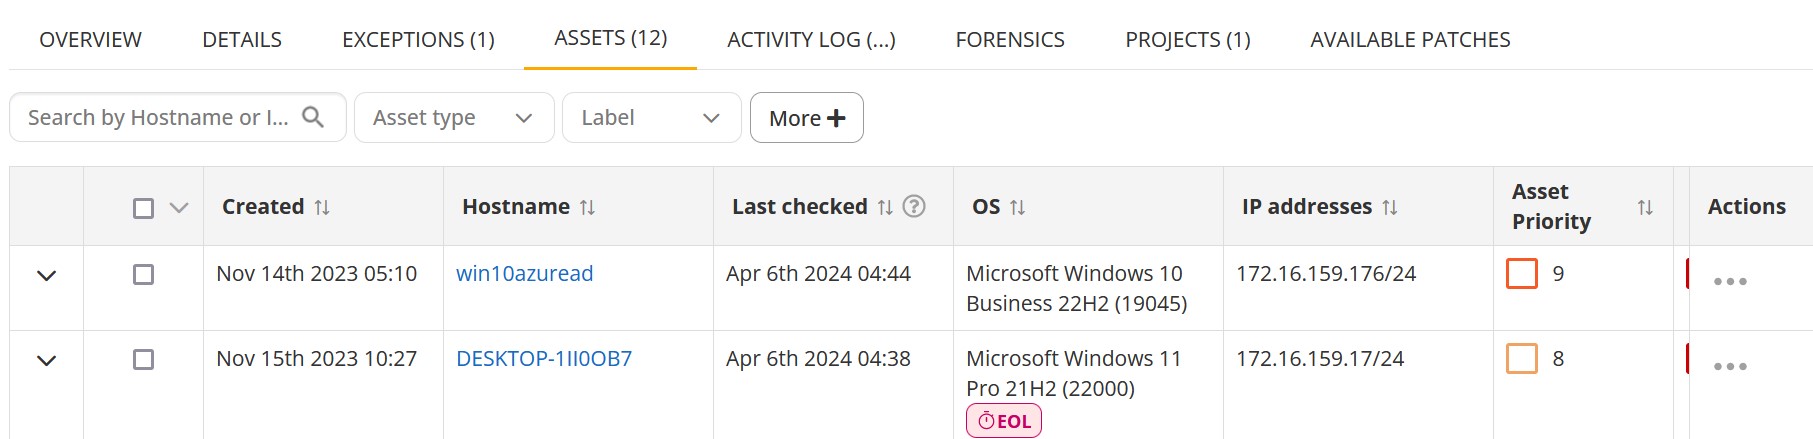
The Assets Inventory list displays the list of assets on which the issue is detected. Please note, that the Assets tab is not displayed for Identity issues.
The information is displayed in the grid with the following columns:
| Column | Description |
|---|---|
| Created | Date and time when the issue has been first detected on the asset. |
| Hostname | The hostname of the asset. |
| Last Checked | Indicates when the server last received findings related to this issue from the agent or collector. |
| OS | Operating system on the asset. |
| IP Addresses | IP addresses on the local network interfaces on the asset. |
| Asset Priority | The asset priority on a scale of 1-10. |
| Issue Priority | The issue priority on a scale of 1-10. |
| NPS | The Nanitor prioritization score of the issue. |
| Vulnerable Software | For vulnerability issues, shows the software detected as vulnerable on this specific device, with link status indicators (green checkmark for linked, yellow warning for unlinked), detection source badge, and software type. |
| Action | Allows adding an asset to exceptions or requesting re-check to verify that the issue has been resolved on this asset. |
The Assets tab supports filtering by Software link (Linked, Unlinked, or All) to narrow results based on the vulnerable software inventory link status.
Identities (Identity issues only)

The Identities Inventory list displays details of the identity on which the issue is detected.
The information is displayed in the grid with the following columns:
| Column | Description |
|---|---|
| Created | Date and time when the issue has been first detected on the identity. |
| Username | The username of the identity. |
| Full Name | The full name of the identity. |
| Location (Domain) | The name of the asset (for local users) or a domain name (for Active Directory users). |
Projects
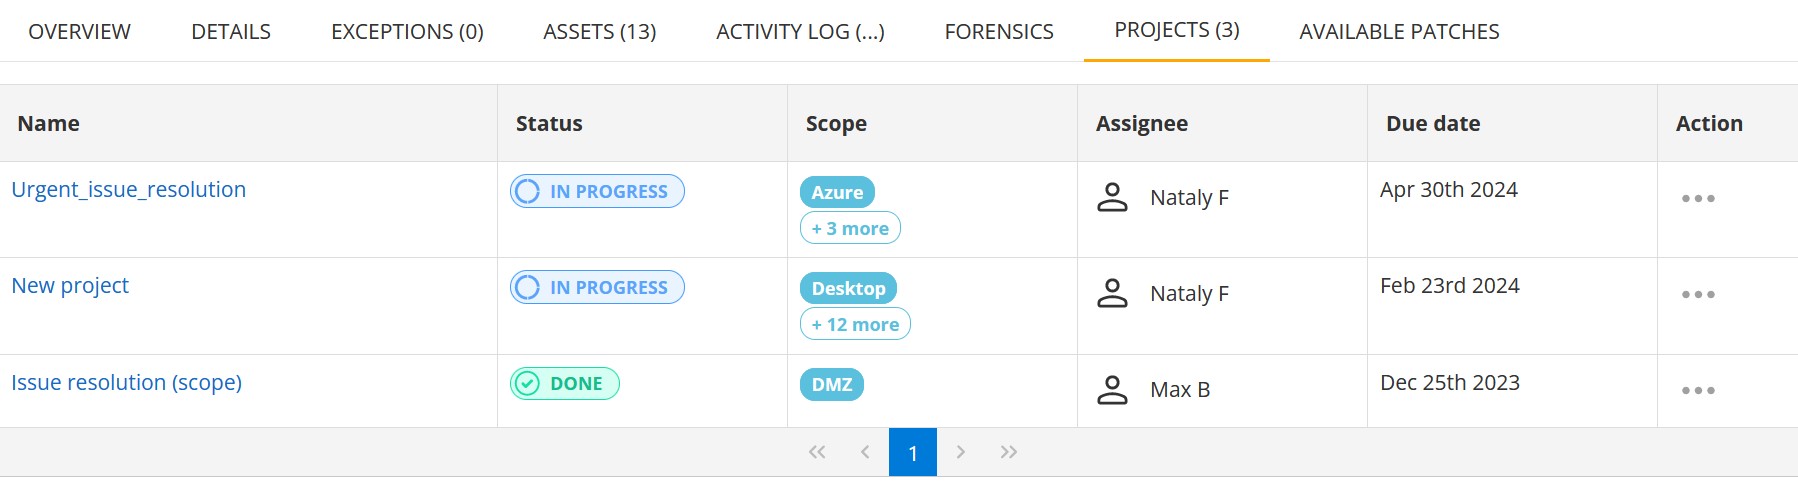
The Projects Inventory list displays Issue resolution projects to which the issue is assigned.
The information is displayed in the grid with the following columns:
| Column | Description |
|---|---|
| Name | The name of the Project. |
| Status | The status of the Project (Backlog, In progress or Done). |
| Scope | The assets that are within scope for this project. It can be All assets or a list of selected assets and labels. |
| Assignee | The user to whom the Project is assigned. |
| Due date | The date by which the Project must be done. |
| Action | Allows removing the issue from the project. |
Activity log
Log of all events related to the issue. For example, it lists when an issue was detected or removed on a single asset, or when an exception has been added or removed.
AI Remediation Insights
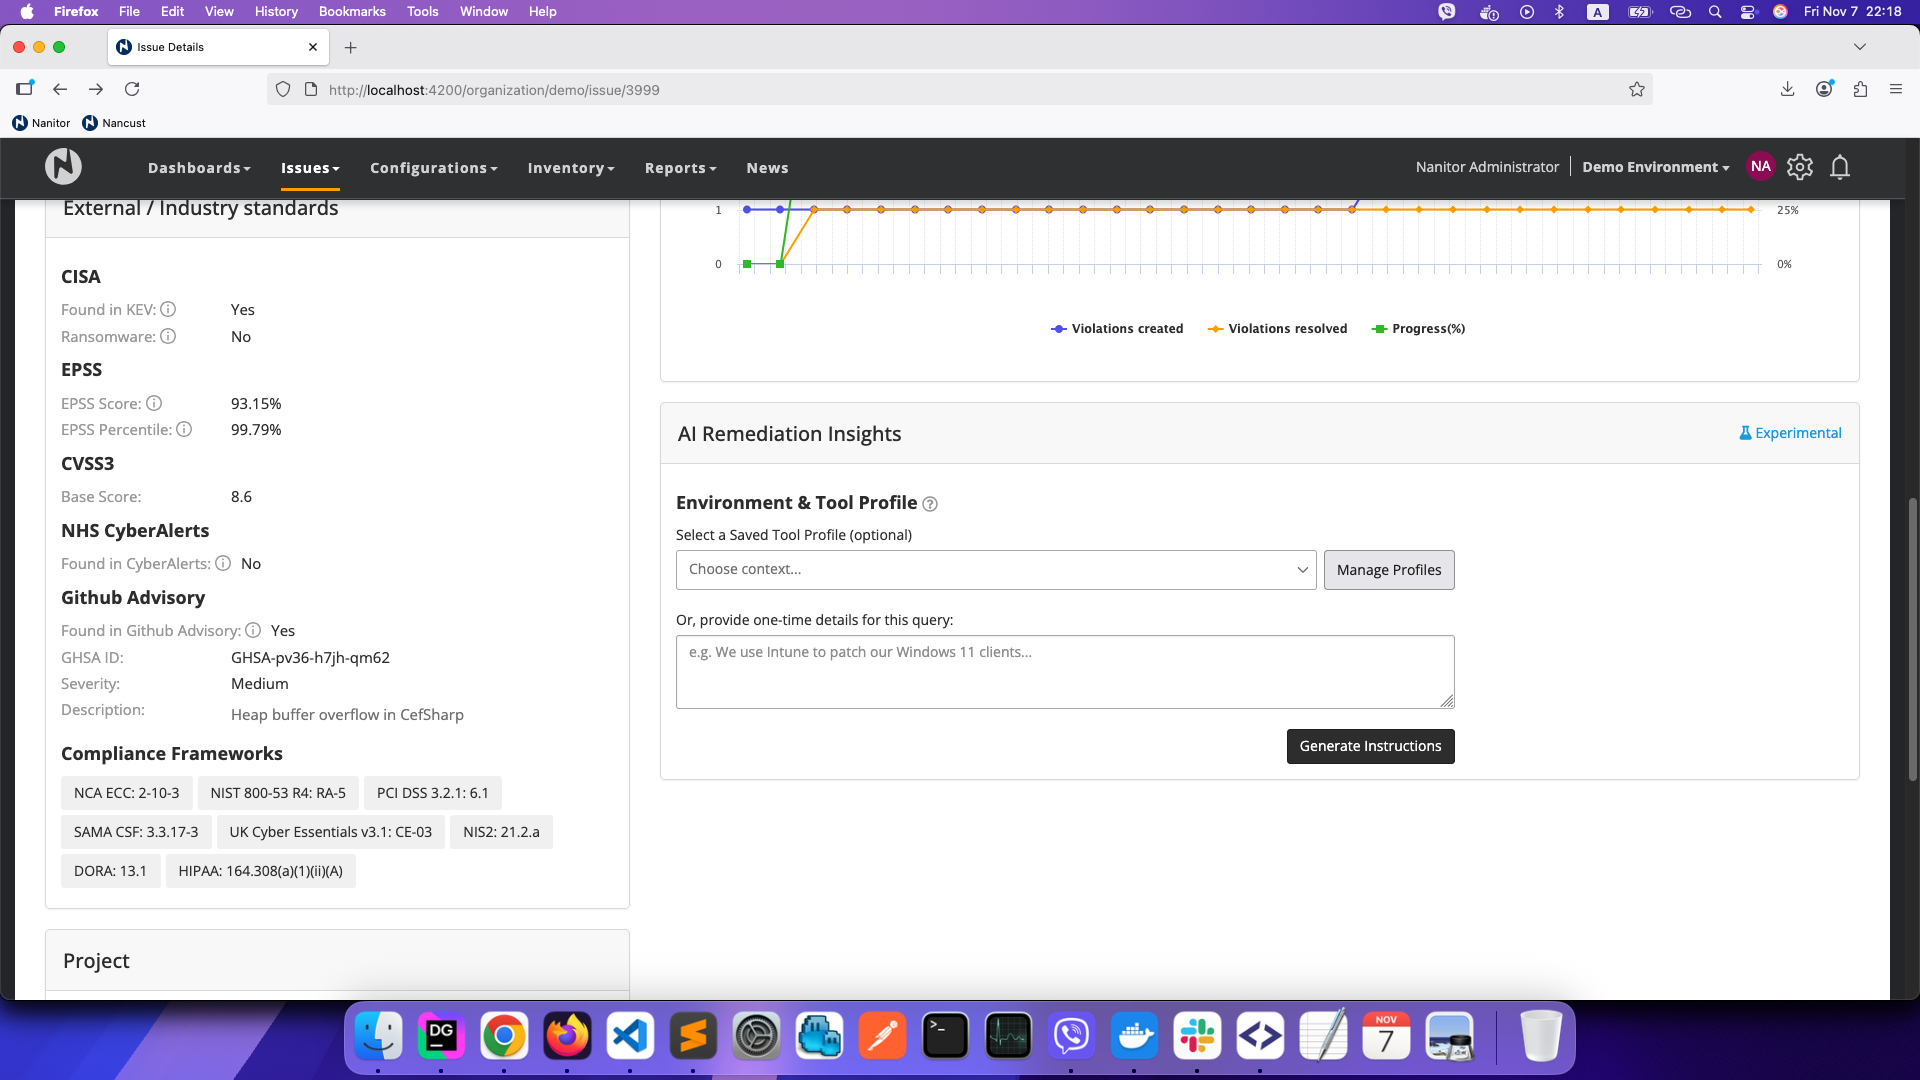
AI Remediation Insights uses artificial intelligence to generate tailored remediation suggestions for detected issues. This feature helps you understand how to resolve security issues by providing context-aware guidance based on the issue details and your environment. The AI Remediation Insights section appears on the issue detail page when AI features are enabled — see AI settings.
Getting Started
The first time you use AI Remediation Insights, you will be asked to consent to the data processing terms. The consent dialog explains what information is shared with the AI system:
- Issue title
- Issue type
- Issue description
- Operating systems affected and number of assets
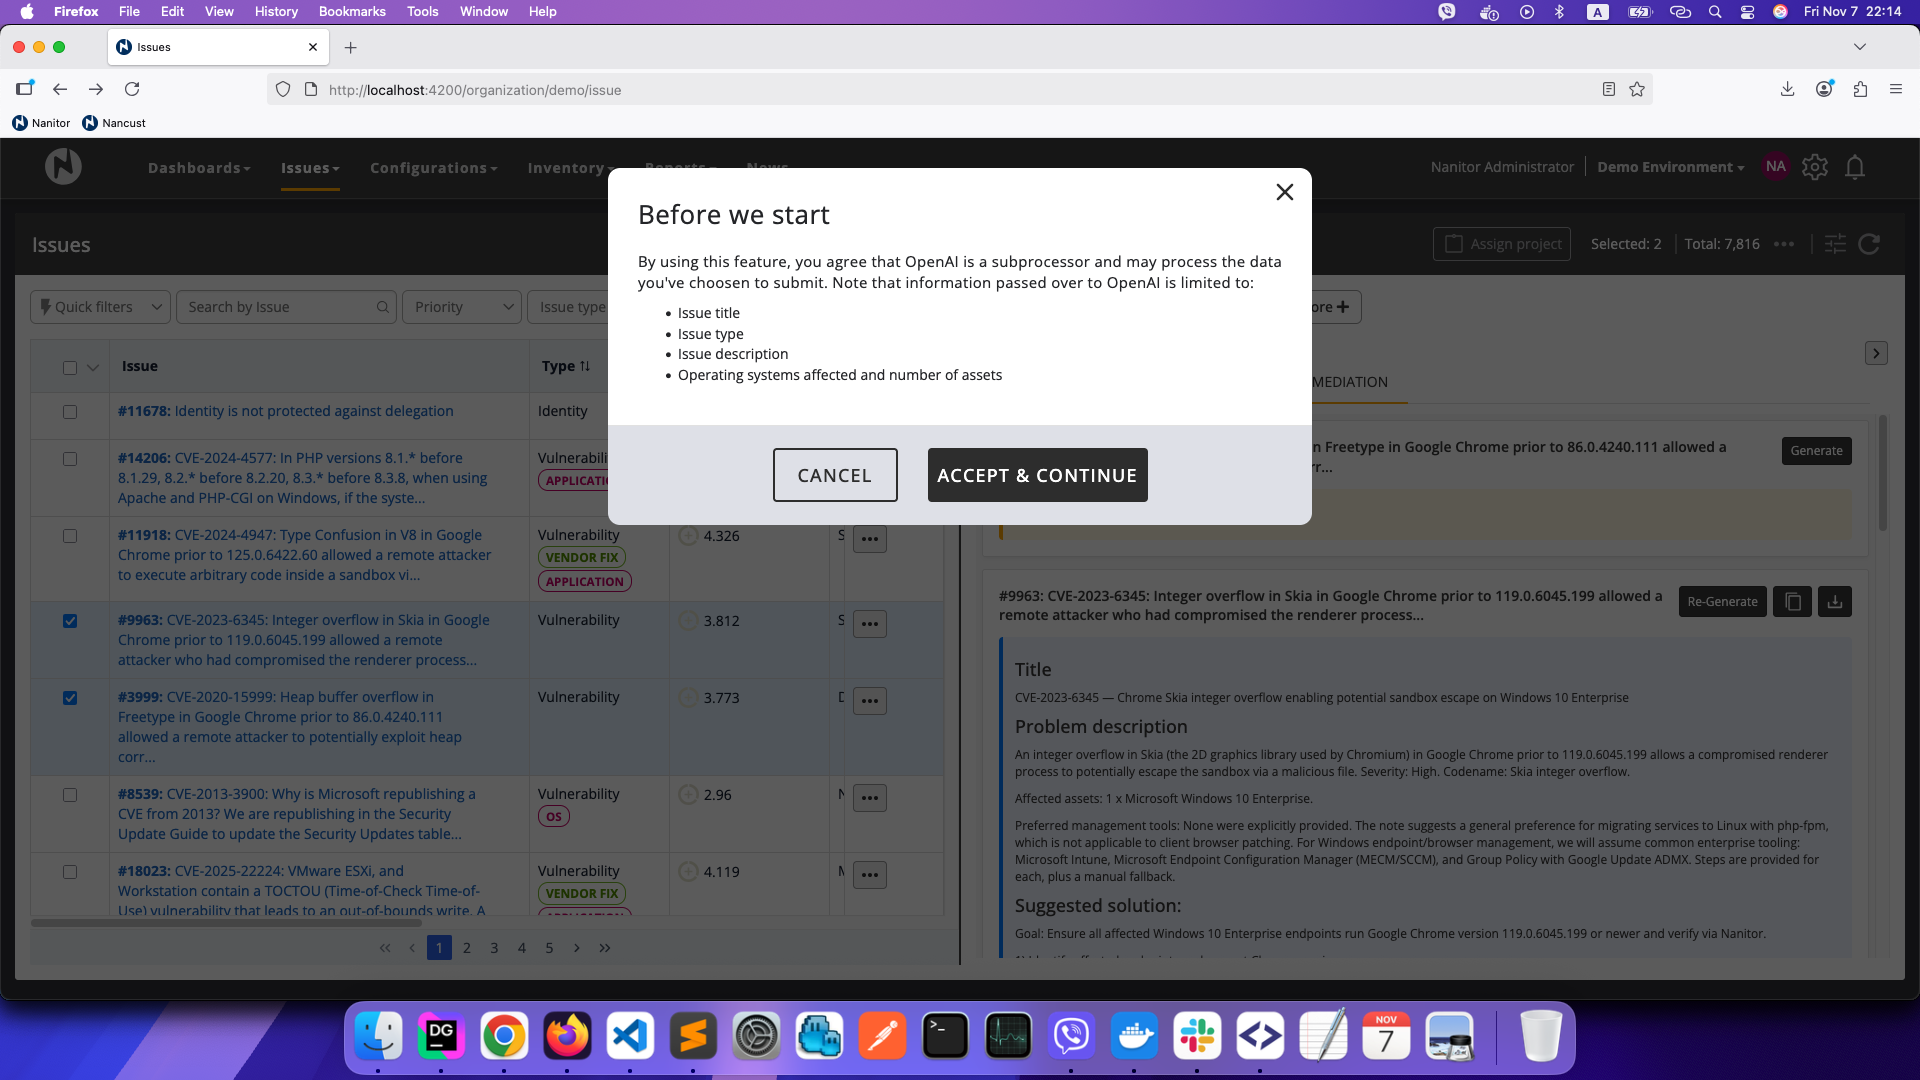
Review the data disclosure, check the acknowledgment checkbox, and click I agree to enable the feature. This is a single "AI Features" consent shared with AI Root Cause Analysis below — accepting it here also enables RCA, and withdrawing it disables both features. You can manage or withdraw your consent at any time from Admin → Personal Settings → Privacy & Consents.
Environment & Tool Profiles
To get more accurate and relevant remediation advice, you can provide context about your environment by creating Environment & Tool Profiles. These profiles describe the tools, platforms, and processes you use (such as Intune, Jamf, WSUS, or other management tools).
To manage profiles:
- Click Manage Profiles next to the profile selector
- Create a new profile by providing a name and description
- Select a saved profile when generating remediation instructions
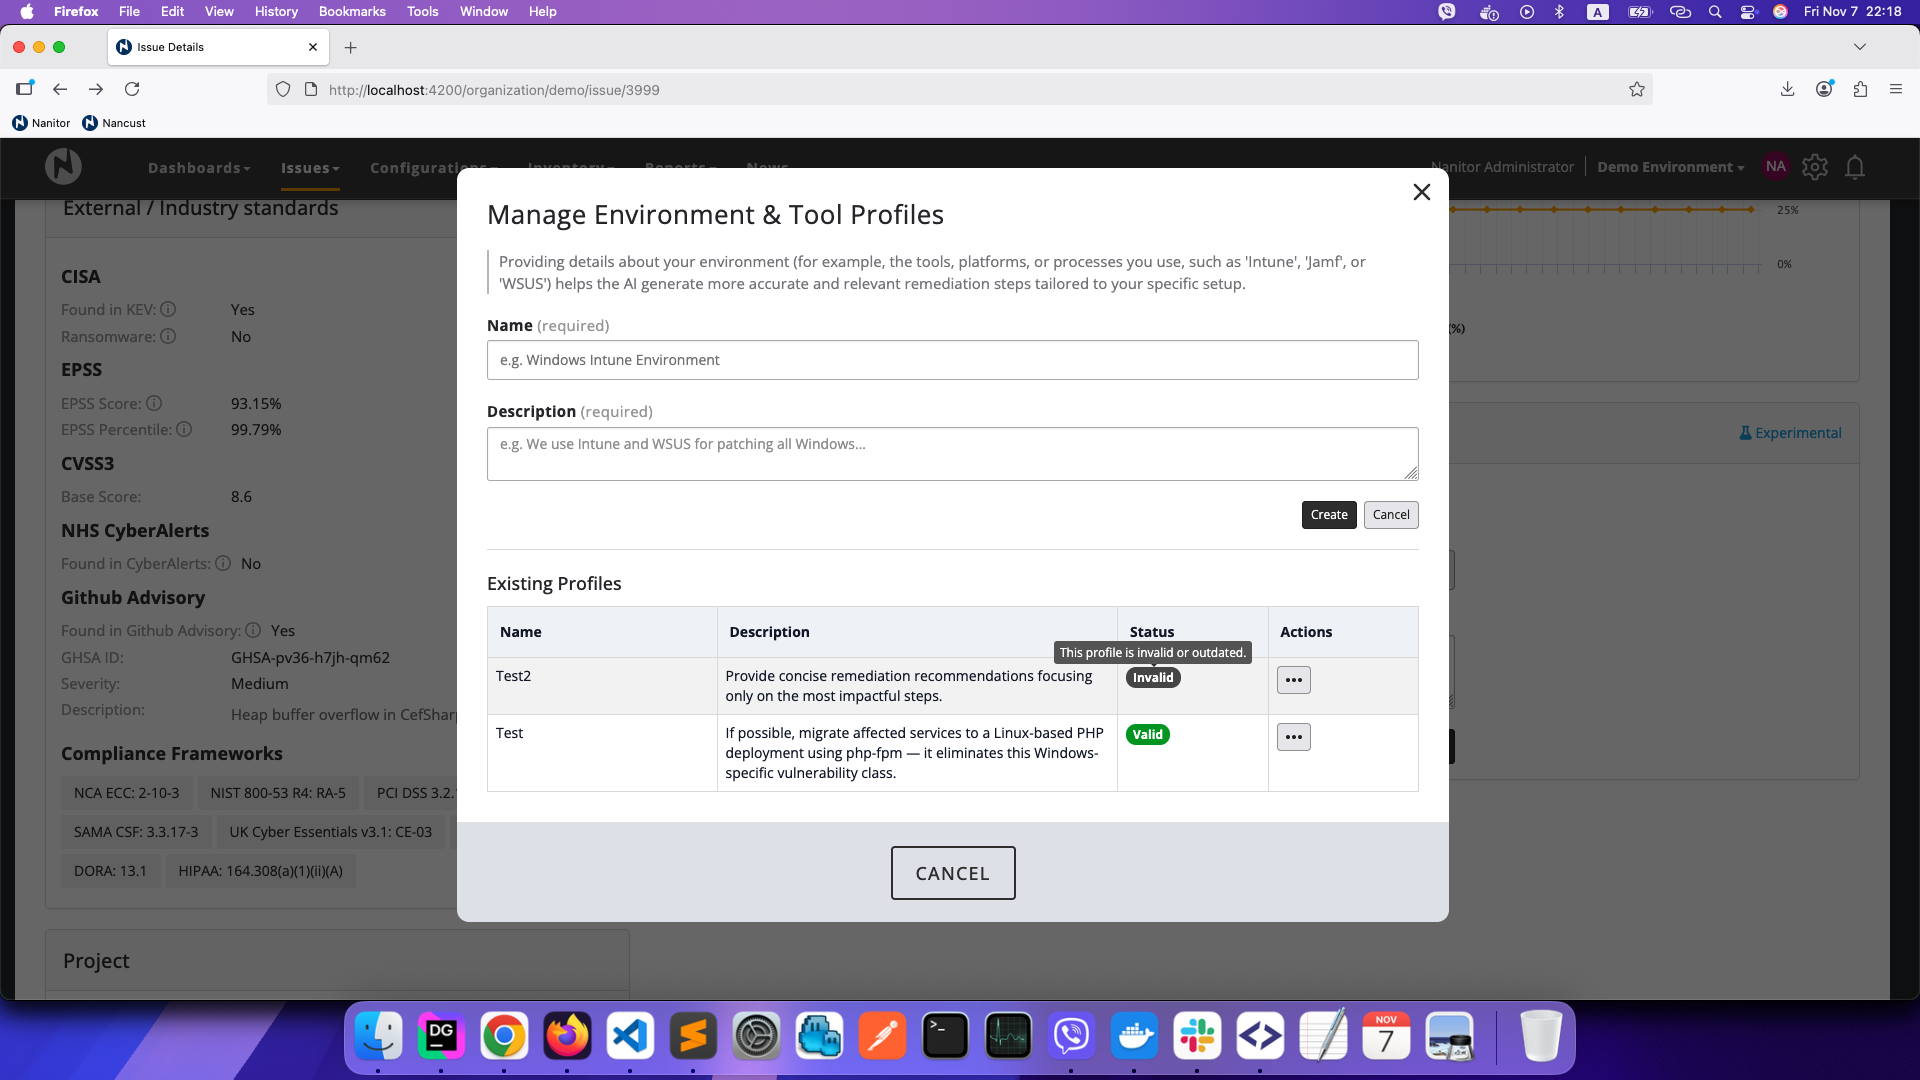
Profiles are validated periodically. If a profile becomes outdated or invalid, it will be marked accordingly and you can update it.
One-Time Queries
If you don't want to save a profile, you can provide one-time context for a specific query. Simply enter details about your environment in the text area below the profile selector before clicking Generate Instructions.
Using AI Remediation
- Navigate to an issue's detail page
- Scroll to the AI Remediation Insights section
- Optionally select a saved Environment & Tool Profile or enter one-time context
- Click Generate Instructions
- Review the AI-generated remediation guidance
You can regenerate instructions if needed, and copy or download the results for reference.
For details on what data is shared with the AI service and how it is processed, see AI Data Handling and Privacy.
AI Root Cause Analysis
AI Root Cause Analysis (RCA) uses artificial intelligence to classify an issue and analyze its root cause, impact, and recommended actions. Unlike Remediation Insights, RCA examines forensic evidence from affected devices to identify why an issue exists and which component is responsible.
RCA is available for the following issue types:
- Vulnerability
- Misconfiguration
- Patch
- Software Policy
The RCA section appears on the issue detail page for supported issue types when AI features are enabled.
Using AI Root Cause Analysis
- Navigate to an issue's detail page (for a supported issue type)
- Find the AI Root Cause Analysis section
- Click Analyze with AI
- If this is your first time using AI features, you will be prompted to accept the data processing consent
- Wait for the analysis to complete — progress messages are shown during processing
Once complete, the analysis displays a Summary in the collapsed view. Click to expand and see the full analysis:
- Summary — a plain-language overview of the issue
- Classification — identifies the source class (Operating System, Application, Middleware, or Driver), the vulnerable component (the specific library or module affected), and the remediation target (the software package to update)
- Root Cause — the underlying factor that caused the issue
- Impact — who and what is affected, including severity
- Recommendations — high-level actions to mitigate and prevent recurrence
Data Sent for RCA
RCA sends more data than Remediation Insights, including device-level forensic evidence. The data sent includes:
- Issue title, type, and description
- CVE/CWE identifiers and CVSS/EPSS scores (for vulnerabilities)
- Affected device hostnames
- Forensic evidence from affected devices (file paths, registry keys, detection patterns, installed software details)
Data is limited to a subset of forensic matches per device and up to 20 affected devices per issue. For full details, see AI Data Handling and Privacy.
Feedback
After reviewing an RCA result, you can provide feedback using the thumbs up/down buttons. You can optionally add a comment describing what could be improved. This feedback helps Nanitor improve the quality of AI-generated analysis.
Retry
If the analysis fails, a Retry button appears in the section header. Click it to re-run the analysis.