Health status dashboard
The Health Status dashboard is a powerful tool that provides a real-time view of your organization's IT infrastructure health status. With this dashboard, you can quickly and easily assess the current security posture of your organization, and gain insight into the areas that require attention.
The dashboard includes a summary of the overall security posture for the organization, broken down by issue type, and shows trends over time. This allows you to identify areas that require additional attention and prioritize remediation efforts accordingly. Additionally, the dashboard highlights the most impactful issues, providing a clear path towards improving your organization's security posture.
Within Nanitor, Health is a comprehensive approach to tracking the overall security posture of your organization, based on the fundamental security areas that Nanitor provides checks for. To learn more about how Health works and how to optimize its use, see the User Guide - Health page.
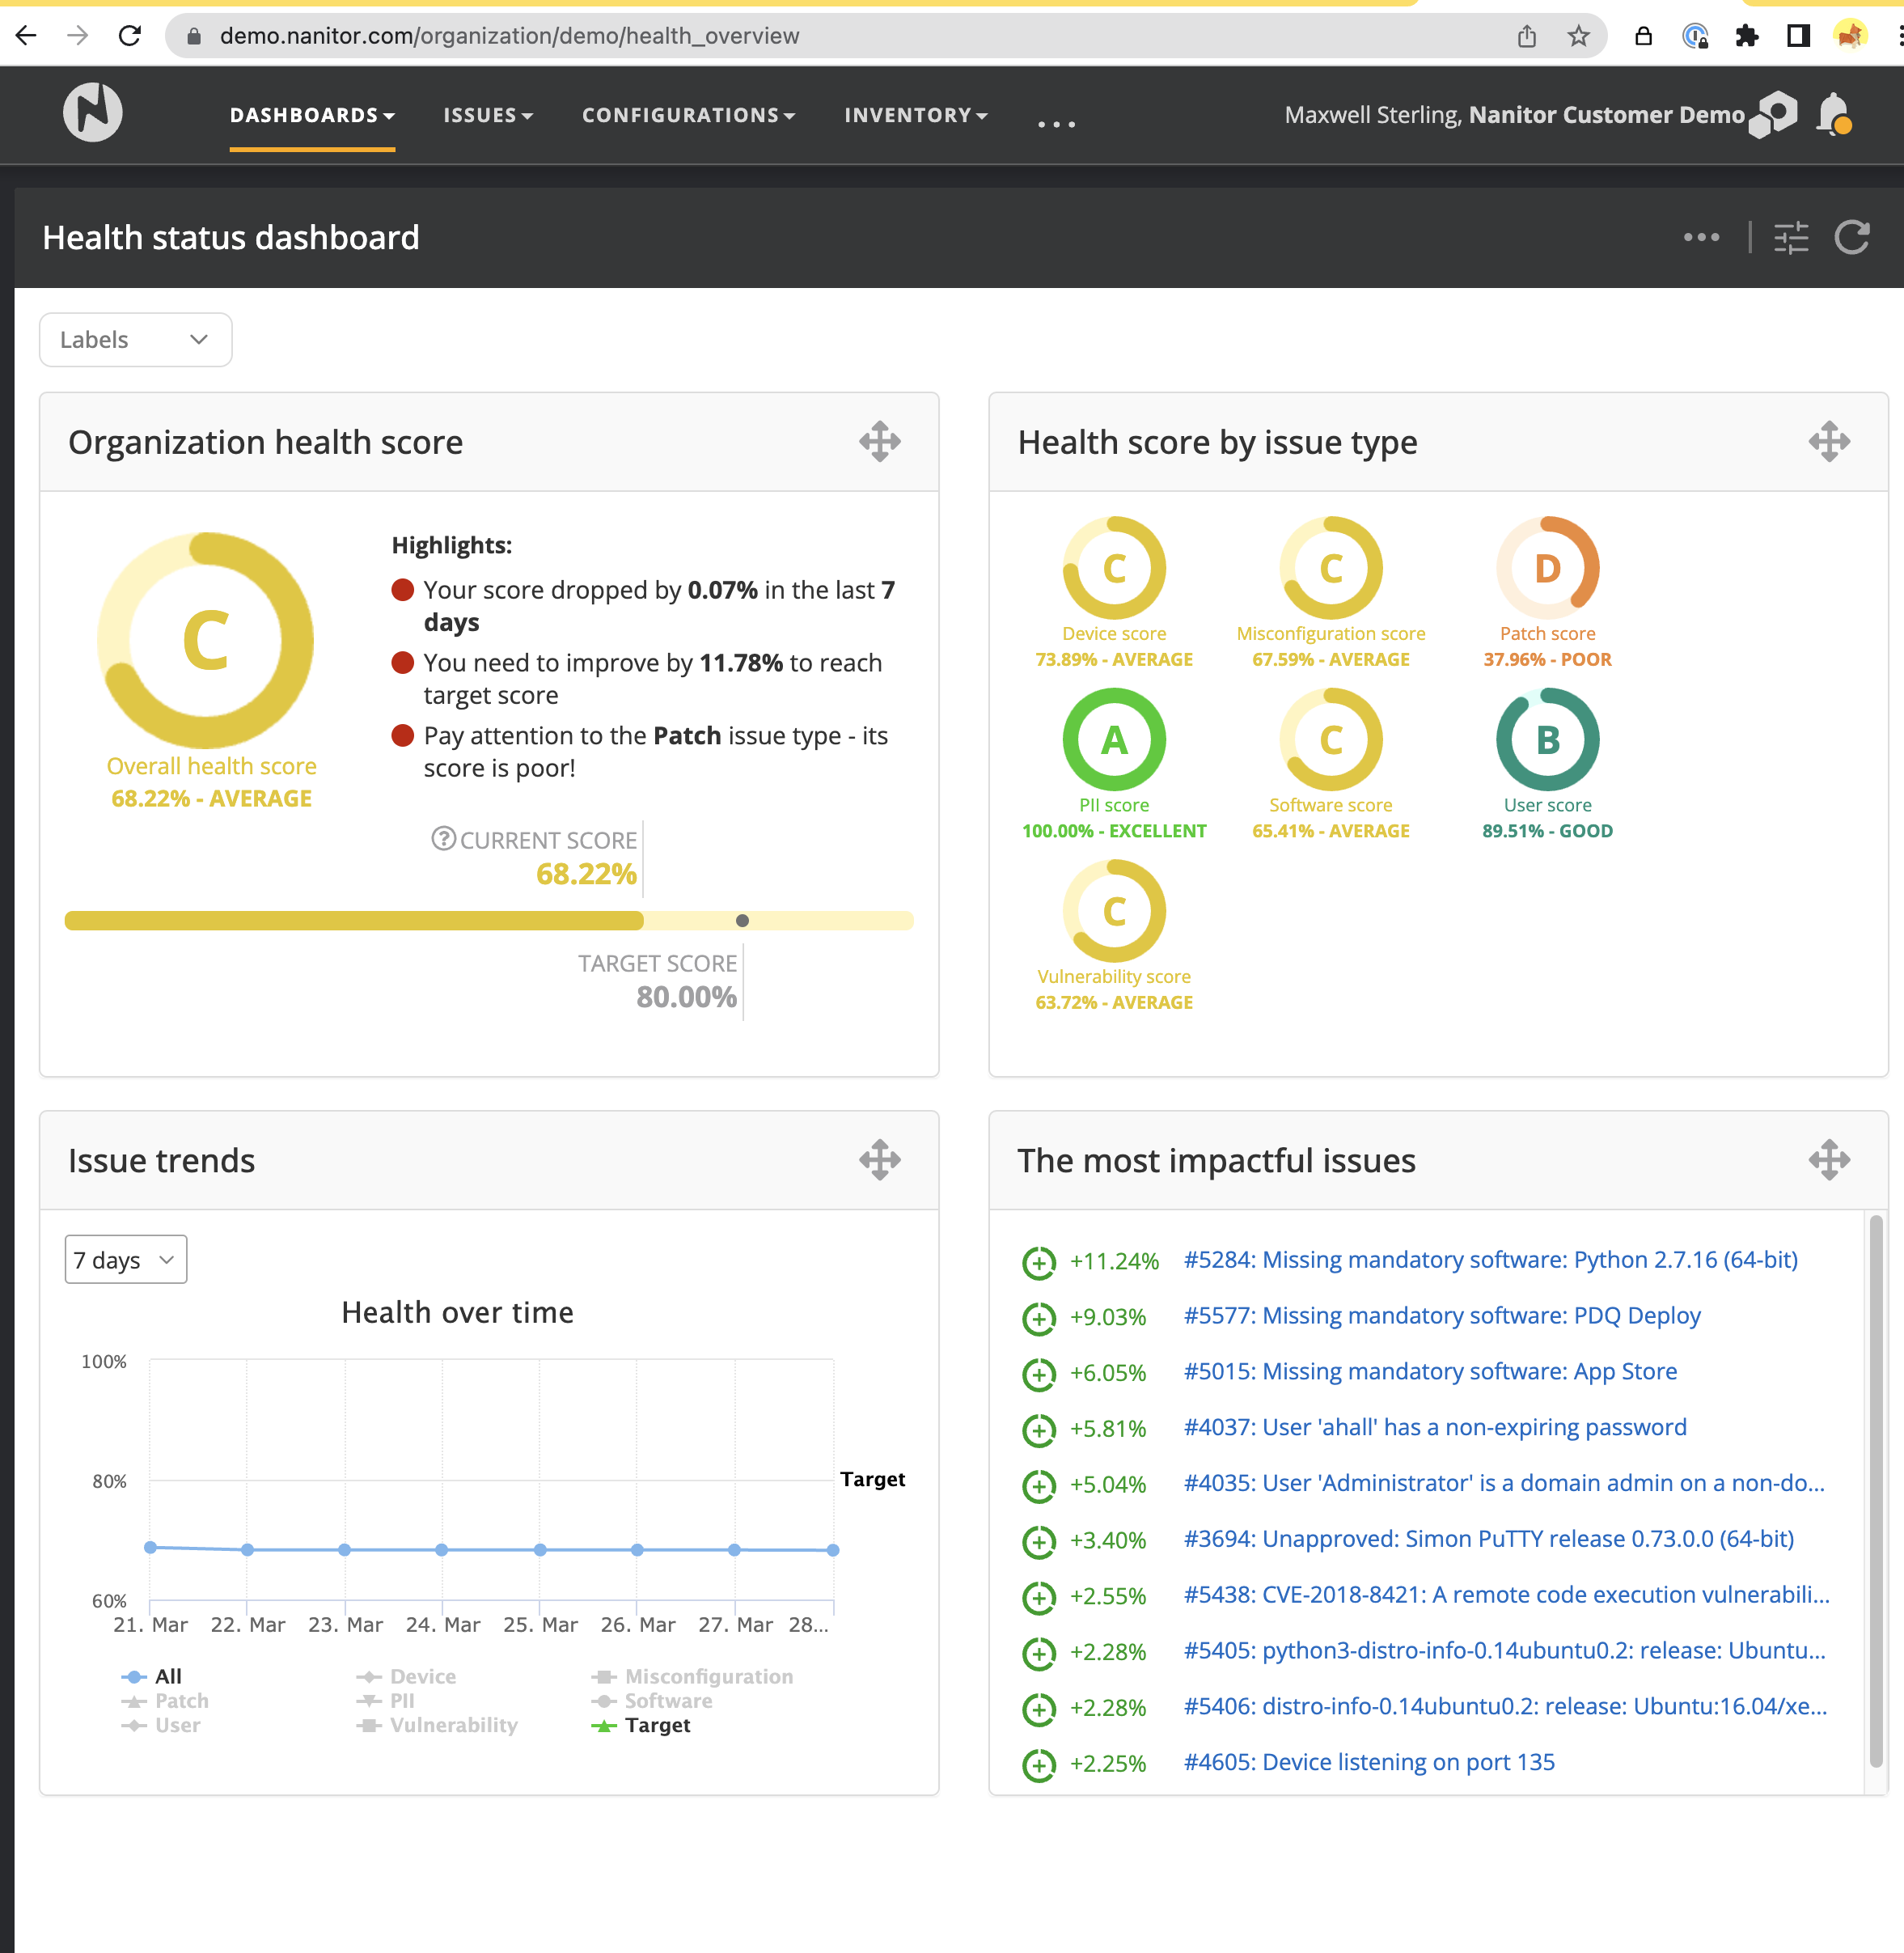
A screenshot of the Health status dashboard is shown below.
Available widgets:
- Organization health score widget: Shows the "Overall health score" for the organization both as a percentage and as a letter grade. The target score is also shown for comparison. The target can be set in the actions on the dashboard. In addition, there is a highlights section that summarizes any noteworthy statistics or changes to pay attention to.
- Health score by issue type widget: Shows the organizational health score in terms of individual issue types. This helps to identify gaps and identify areas for improvement.
- Issue trends widgets: Shows the Organizational Health trend over time. It can be broken down by issue types also by clicking on specific issue types in the legend to display them on the graph.
- The most impactful issues: Shows the issues whose resolution would have the biggest improvement on the health scores. Helps to identify the issues that could lead to big improvements.
Filters
- Asset label: By default the dashboard shows data for the entire organization. By selecting a label to filter on, the health report can be viewed for only a subset of assets.
Actions
- Set Health Score Target: This brings up a dialog where the target health score for the organization can be set. Typically it may make sense to review the targets and set goals periodically such as monthly or quarterly. The goal can be set by entering the desired target value and clicking Save.
- Export: The health report can be exported to PDF.
