Health scores
Health overview
The Nanitor Health Score system is designed to assess the resilience of the IT infrastructure and empower users to defend against possible data breaches and prevent downtime of essential services.
A breach of one vulnerable asset often propagates to other assets on the network, eventually leading to downtime or theft or loss of important data. The health score system evaluates the security and resiliency of each asset and provides a comprehensive view of an organization's cybersecurity posture. The higher the health score, the higher the resiliency and health of the overall organization. By prioritizing the protection of individual assets, organizations can allocate resources effectively to maintain the overall security and health of their systems and data.
The system provides management with simple metrics to set goals and track progress, while team members performing remediations have clear goals and progress tracking visible to their supervisors. It forms the basis of what we refer to as our asset-centric approach and is sometimes called cybersecurity asset attack surface management (CAASM).
The Nanitor Health Score system provides a simple way to understand the cybersecurity status of your overall organization including details down to individual assets in terms of compliance with the technical security policy as set in Nanitor. The health score is calculated based on the unified issue system that Nanitor utilizes where each issue is a potential security problem and in violation of the technical security policy. The health is defined in terms of Asset Health for each asset, and then the overall Organization Health Score is calculated for the entire asset fleet. Each health score can range from 0-100 and letter grades are assigned ranging from A down to F as shown below in the Grading table.
The main benefit of the Nanitor Health Score is that managers and teams can be on the same page and easily communicate their status and set improvement goals. It also provides a way to show progress on remediation work.
NOTE: It is worth keeping in mind that health is a proactive measure of the cybersecurity posture and is great for tracking the overall health and resilience of the organization. It is not the best tool for watching out for critical vulnerabilities coming up now. For such cases, the Nanitor Diamond is a more appropriate tool for reactive measures. It is recommended to always look at both the health and the amount of P0 issues. For more information on that see Prioritization.
Organization Health Score (OHS)
The Organization Health Score (OHS) gives a snapshot of the state of the entire organization. The OHS is built from the bottom up, where every single monitored asset and its priority is reflected in the score. Thus, it gives an important overview for management on how the organization is doing overall and breaks it down into fundamental issue types. The OHS enables managers to set measurable goals and drive decisions about where to invest and put efforts into improvements.
The health scores can also be broken down by issue type to get a good grasp of what fundamental areas (issue types) need the most improvement across the entire organization.
Asset Health Score (AHS)
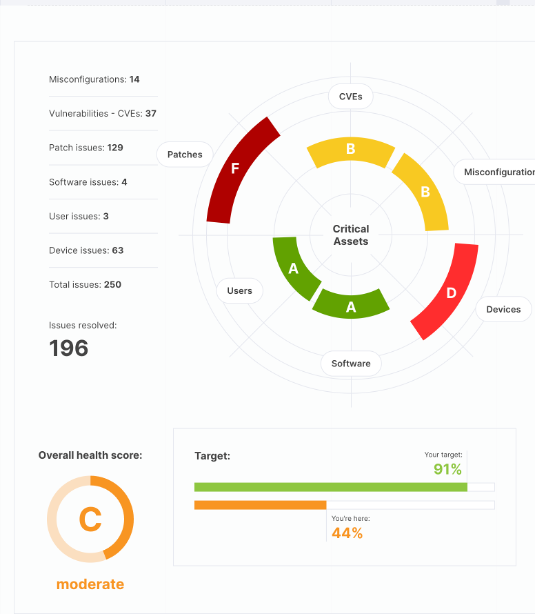
The Asset Health Score (AHS) reflects the overall state of each asset. The score is composed of how well the asset is scoring in terms of all the different issue types. A device might be doing well in terms of security patches, but poorly in misconfigurations, in which case the overall score would reflect that status. Each key issue type is related to a fundamental area of cybersecurity: misconfiguration, vulnerabilities, patches, etc. The following figure illustrates this point graphically, i.e. how an asset can have different standings per issue type.
Note that unmonitored assets (discovered through network discovery or uploaded through the CSV import feature or the API) do not have health scores, as Nanitor is unable to detect issues present on such assets. To ensure the greatest possible coverage, make sure to install the Nanitor Agent or configure a Nanitor Collector to monitor as many of your assets as possible.
To be considered fully healthy, an asset needs to be doing well in each fundamental area. Similarly, there is a limit to how much each area can drag an asset down. Thus, each fundamental has a weight, the asset gets a score of 0-100% in each area, and the overall asset score is calculated based on the weights and scores of each fundamental. For more details see the Calculation details section.
The fundamental score weights are indicative of both how important that area is to asset health, and how much coverage Nanitor has for the different fundamentals.
The Health Scores are composed of key cybersecurity fundamental controls and are in alignment with best practices and widely used compliance standards such as NIST and CIS controls:
- Security configurations play a critical role in device security. When configurations are inadequate, the resulting system may be overly permissive, with numerous open services and potential security vulnerabilities such as default accounts and passwords. As a consequence, a security breach could have a high blast radius, making it critical to prioritize strong security configurations. By doing so, it is possible to minimize the potential impact of a security breach and limit the extent to which an attacker can access sensitive information or cause damage.
- Known vulnerabilities can be considered equivalent to open holes that are easy to exploit, often with public exploits available that anyone can download. Remediation of known vulnerabilities is key to a healthy asset posture.
- Security patches for critical vulnerabilities should be applied within a given period, typically 7 - 30 days depending on company policy. While related to known vulnerabilities, patching is measured separately and is indicative of the performance of the patching teams, and days to patch is a KPI for the patching teams.
- User issues, including control of administrative privileges, are an important portion of security.
- Device issues are issues for a given device that do not fit into other categories. For example, end-of-life operating systems, unapproved open ports, etc.
- PII issues are applicable where personally identifiable information such as credit cards and social security numbers should not be stored, and findings indicate issues that need to be addressed.
- Software non-compliance issues are applicable when software that has been blacklisted is identified on a device, or if software that has been marked as mandatory is missing. By setting the Software Policy to "Detailed", Nanitor administrators can require all installed software to be whitelisted, in which case issues will be created for any software found on a device that is not on the whitelist.
Grading table
The Health Grade is determined by the health score. This applies to all cases where a letter-based grade is shown. The following table shows how the grade is determined.
| Health Grade | Health Score | Description |
|---|---|---|
| A | 90 - 100 | Excellent |
| B | 75 - 90 | Good |
| C | 50 - 75 | Average |
| D | 35 - 50 | Poor |
| E | 25 - 35 | Very Poor |
| F | 0 - 25 | Failing |
| P | No score | Pending |
Setting Goals
To achieve a systematic approach towards cybersecurity, it is recommended to set a health goal. When starting with Nanitor, it is common to have a lower health score. However, depending on the organization's risk appetite, we recommend striving for a score of greater than 90% and onboarding the majority of assets.
While achieving this goal may not be feasible immediately, it is important to establish a plan. For example, if an organization currently has a health score of 50%, setting a quarterly goal to reach 75% may be more achievable, followed by aiming for 90% in the following quarter. After reaching the 90% mark, the goal should be to maintain that score or increase it further, depending on the organization's risk appetite. By setting and achieving health goals, organizations can proactively manage their assets and improve their overall cybersecurity posture.
The Health Score target can be set in the user interface in the Health status dashboard as can be seen here. Once the target goal is set, it is included in health graphs and reports.
Monitoring Progress
It is recommended to review the health goal at least quarterly. The progress of the health score and goals can be seen in the Progress dashboard and also in the Health trends widget in the Health status dashboard.
Calculation details
The formula for calculating the Asset Health Score is the weighted average of the health scores for each issue type.
The health score for a given issue type is in the range of 0 to 100. It is obtained by summing up the issue priorities of all issues on an asset. The idea is that if there are 0 issues and the sum is 0, then the device is 100% healthy. As the sum gets bigger the situation or health is getting worse until it reaches a point above which the situation is already so bad (unhealthy) that it cannot get worse (value of 0). As the sum grows, the health score drops toward 0, resembling the following curve.
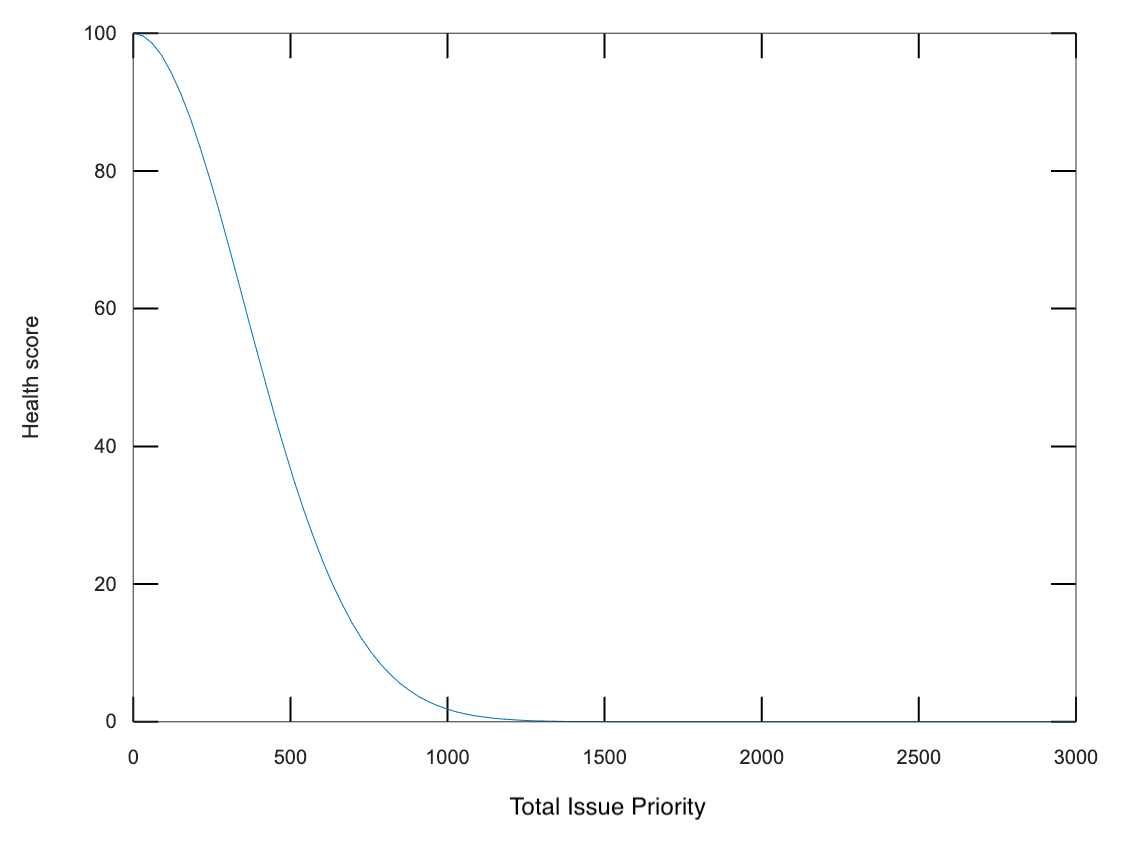
The shape of the curve is decided empirically for each issue type. The shape may change over time as the Product team at Nanitor is constantly improving the Health scoring system to best reflect the resilience of assets and organizations.
The weights of each of the issue types are shown in the following table:
| Issue type | Description | Weight |
|---|---|---|
| Misconfiguration | Security misconfigurations | 30% |
| Patch | Missing security patches | 20% |
| Vulnerability | Known software vulnerabilities found | 30% |
| Software non-compliance | Software non-compliance, e.g. blacklisted software, mandatory software missing, etc. | 10% |
| PII | Personally identifiable information (credit cards, social security, etc.) | 10% |
| Device | Device non-compliance, e.g. unapproved ports, etc. | 10% |
| User | User issues | 10% |
Note if one or more issue types are not in use, the weight is redistributed towards the other issues such that the total sum of weights is always 100%.
The organization's health is calculated as the weighted average of all the assets in the organization, where the Asset Priority is used as the weighting factor. Thus, higher-priority assets count more than lower-priority ones.
Technically, issue priorities have three components (confidentiality, integrity, and availability). The calculation is made in terms of those three components but the final asset health is calculated as the average of the three.
User interface
Health Dashboard (page)
The Health Dashboard is available from the menu: Dashboards -> Health status
The Health Dashboard page is composed of widgets that describe the health status of the organization.
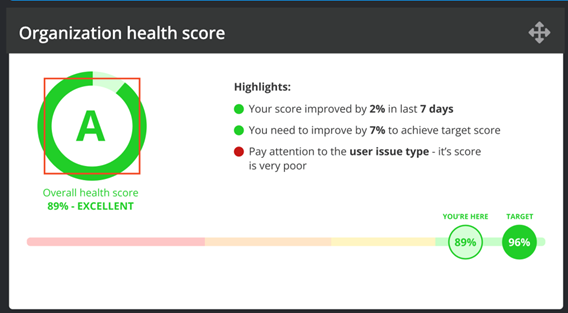
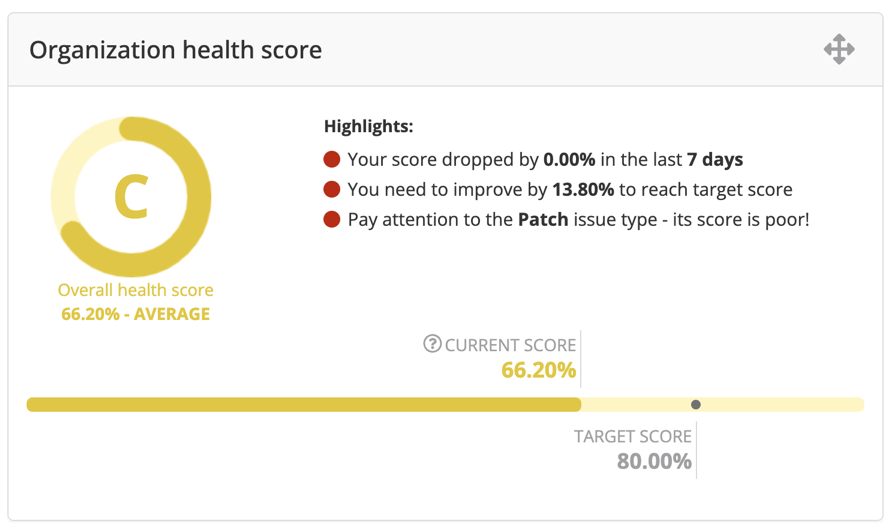
- The Organization health score widget shows the current OHS score and grade, compared with the target health score. It also contains highlight texts that describe something that the user should pay attention to.
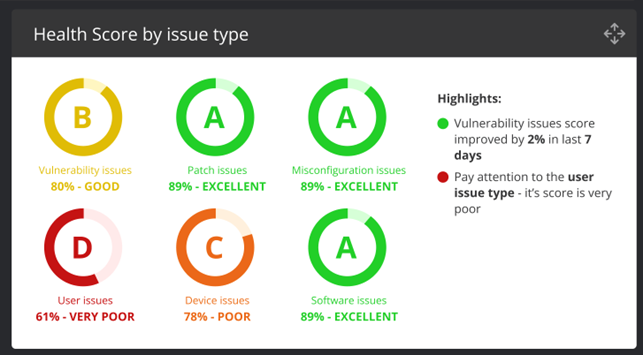
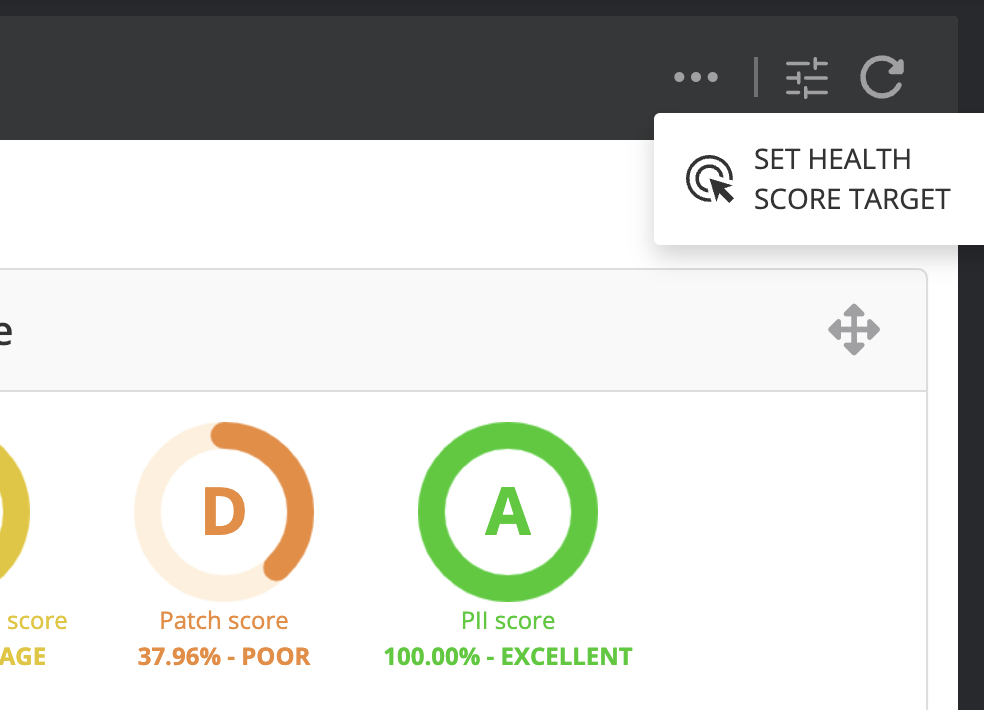
- The Health score by issue type shows exactly how the organization is doing in each of the issue types. It is a great way to identify gaps that should be addressed. For example in the image below, the Patch type is quite poor which might indicate that the organization needs to revisit its patching processes and tooling.
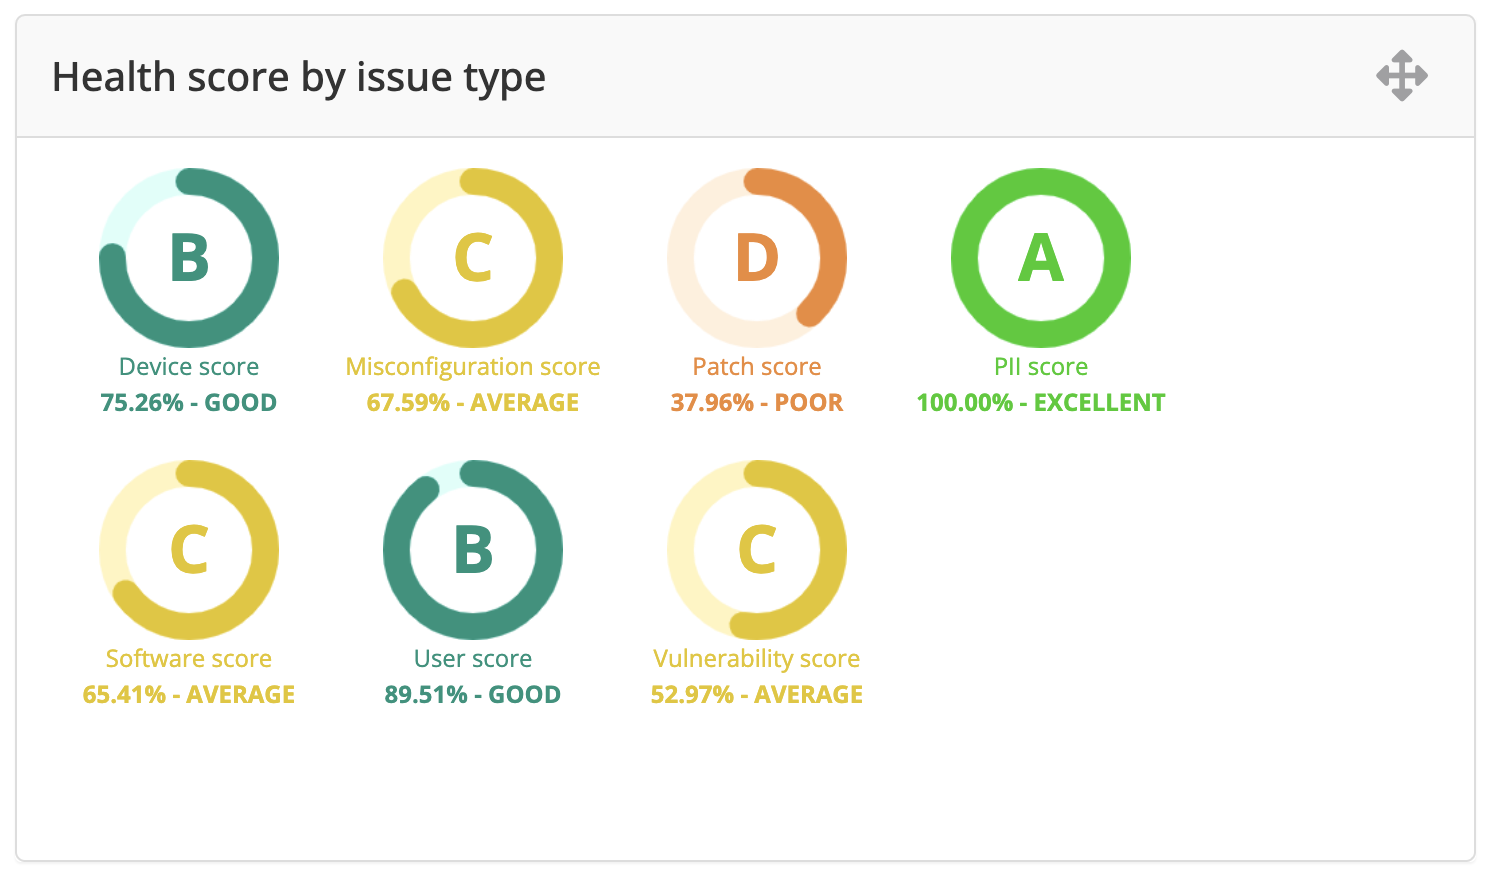
NOTE: In practice, we find that the misconfiguration score is usually the lowest since there are many configuration checks, and assets are often poorly configured with out-of-the-box default configurations.
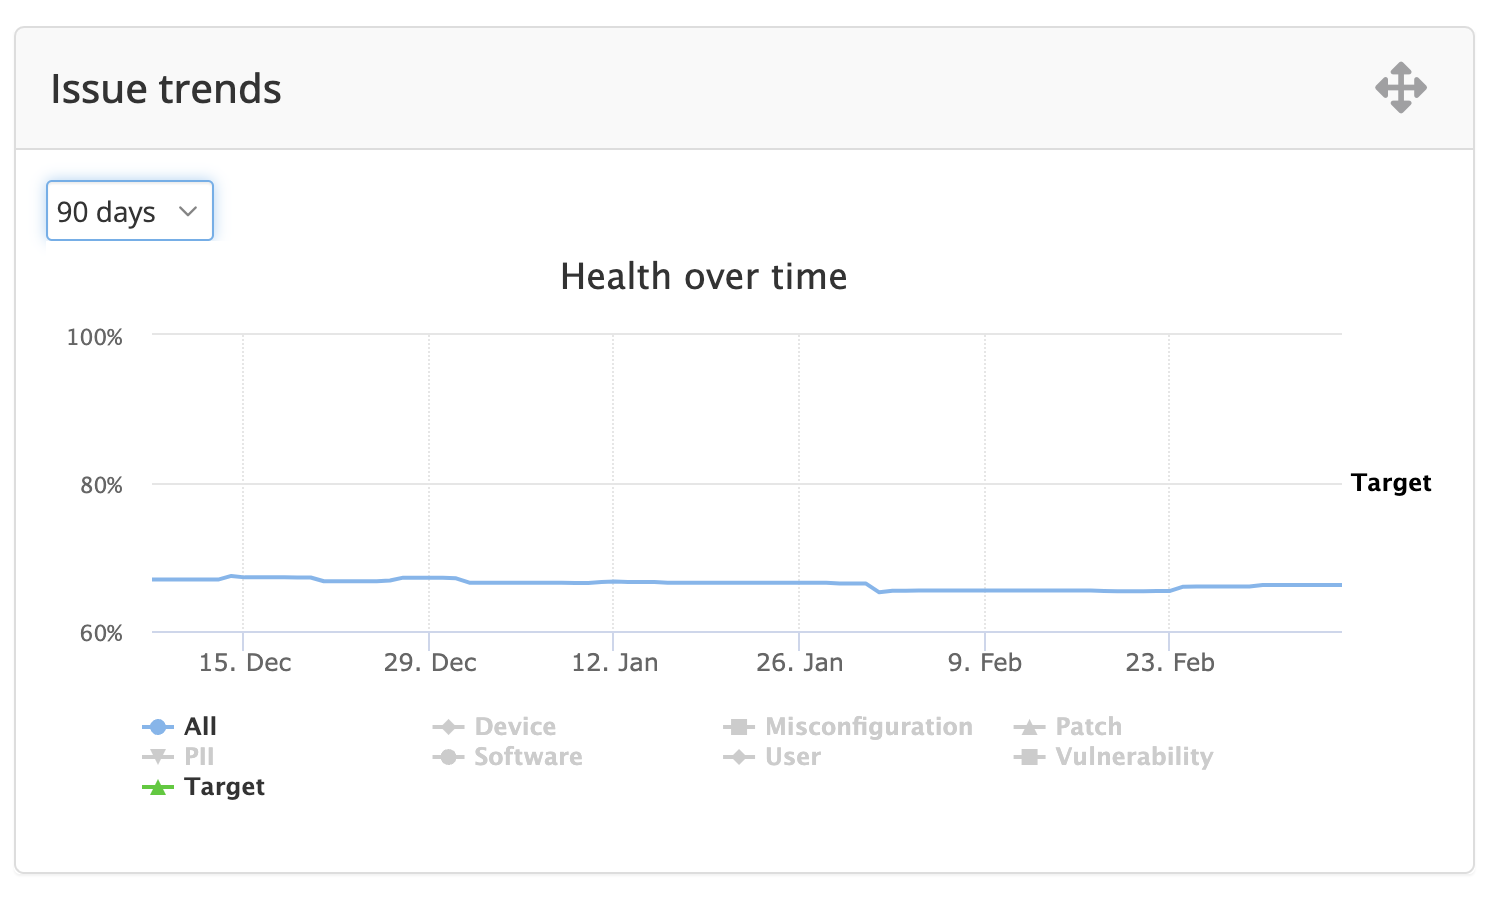
- The issue trends widget shows how the health score has been progressing over time. By default, it shows the overall OHS over time and the target. By clicking on the individual issue types in the figure legend, the trends for each issue type can be seen. The date range can be changed in the dropdown.
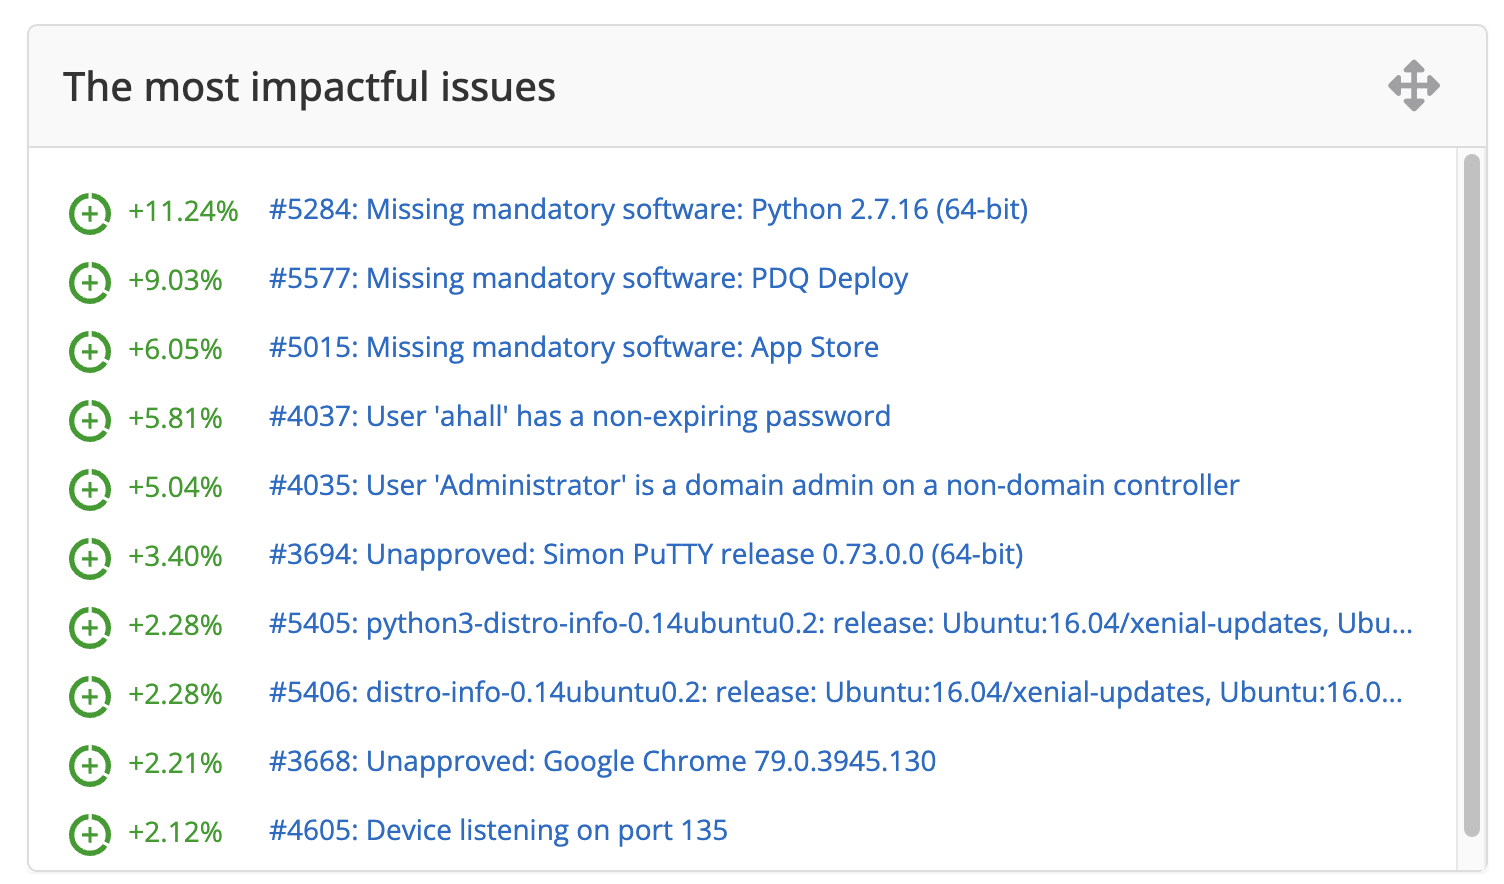
- The most impactful issues widget identifies gaps and clearly shows the issues that if fixed would contribute most to improving the health and increasing the OHS score.
Note that the most impactful issue here might not appear on the top of the Issue Prioritization Diamond, as it is typically a high-ranked issue that is persistent on a large number of assets and thus having a large impact on the OHS. In contrast, the top of the Diamond may show a critical issue that exists on only one important asset.
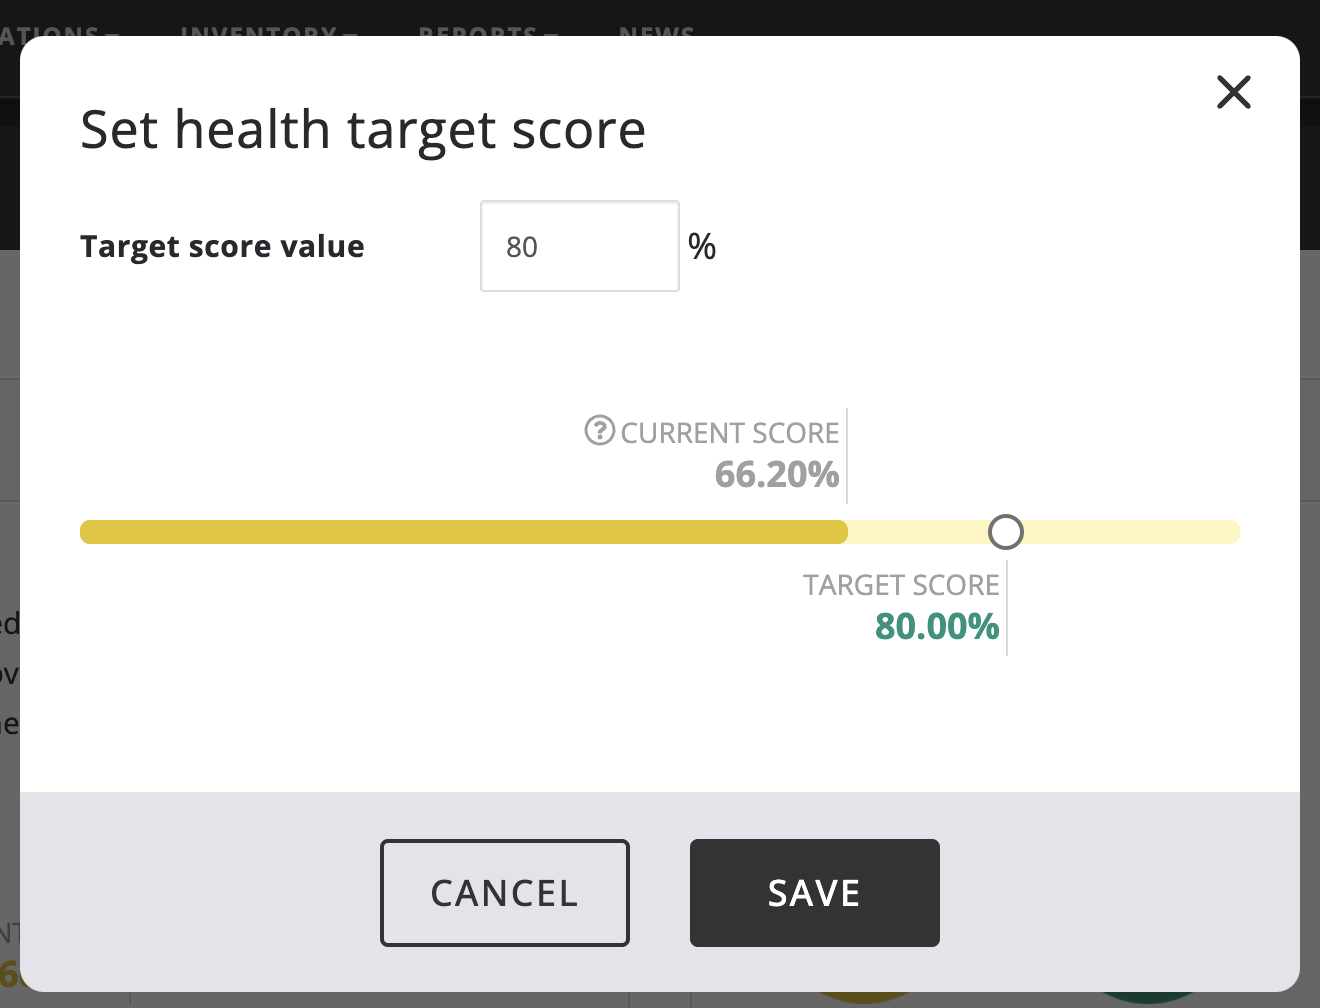
Setting the Health target
The "Set Health Score Target" action in the Actions menu can be used to set the health target.
It brings up a dialog where the desired target health score can be entered or set by dragging the target in the bar and clicking Save.
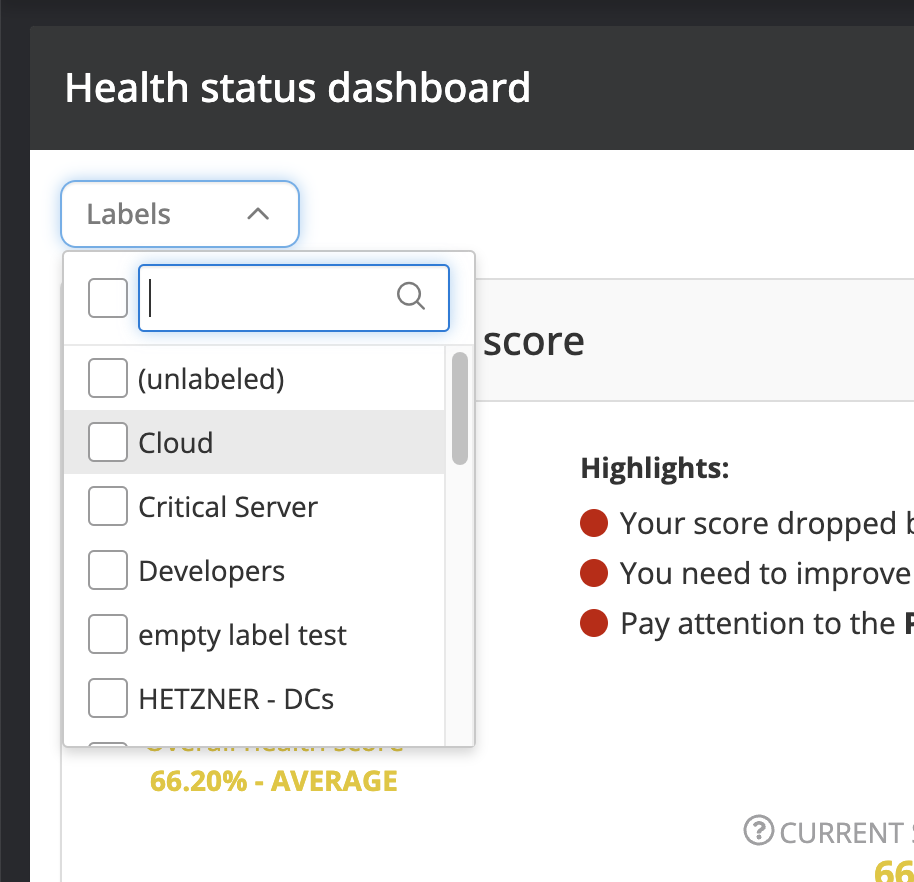
Health for different asset labels
Assessing health in terms of different asset labels can be useful to compare the performance of different teams or services. The health of an individual label can be assessed by using the Asset label filter as shown below. Selecting the desired labels and clicking Apply shows the health status report for the given asset label, as shown below.
Layout
By default, the Health status dashboard is shown with the number of columns that fit the given screen size. However, this can be changed and customized by the user. By clicking the Customize View icon, one can select the number of columns used and also select which widgets to include.
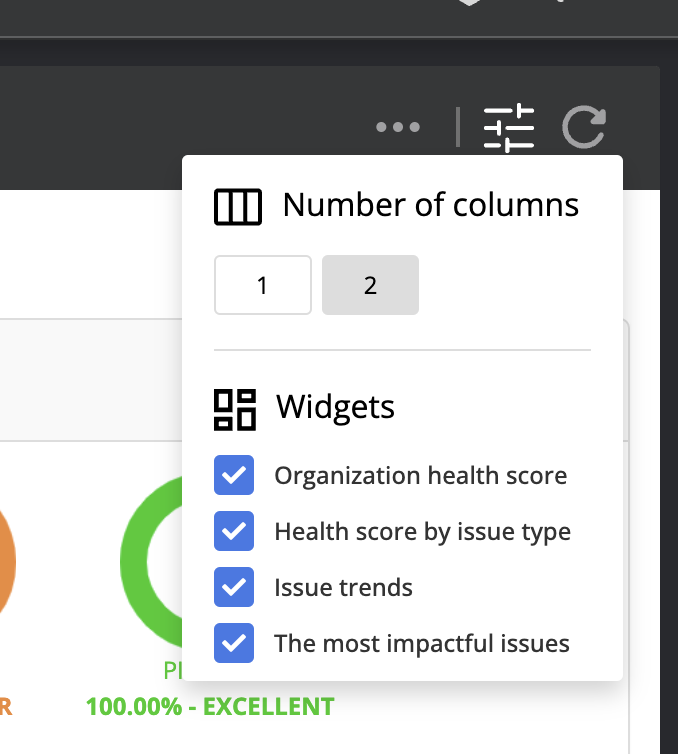
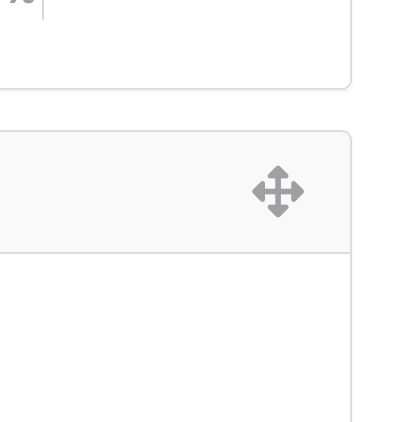
In addition, the user can reorder the widgets as desired using the widget reposition handle icon in the upper-right corner of each widget and simply drag it into the desired position where it will snap in place.
Data refreshing
The refresh icon in the toolbar enables instantaneous refresh of the data in the health report, which fetches the report data from the server and updates the user interface right away.
It is worth noting that on the server side, the data for the health report is typically updated every 6 hours. Therefore when an issue is resolved it can take up to 6 hours for that to be reflected in the health reports.

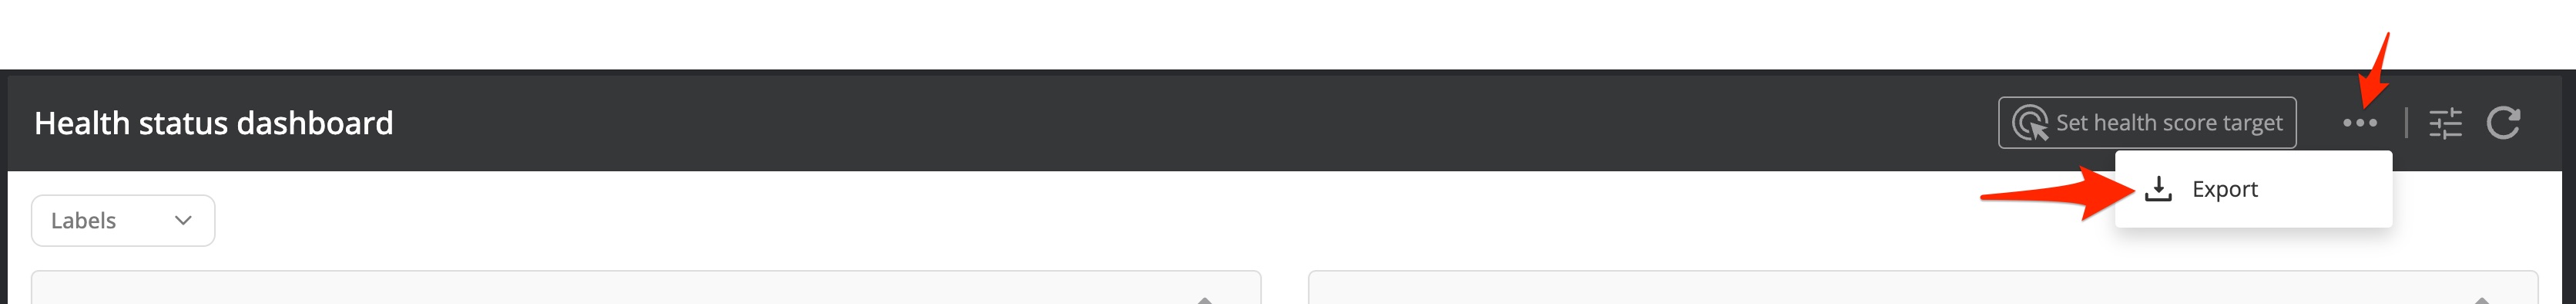
Export the health status to PDF
It is possible to export the health metrics to a PDF report. Select Export from the health dashboard hamburger menu
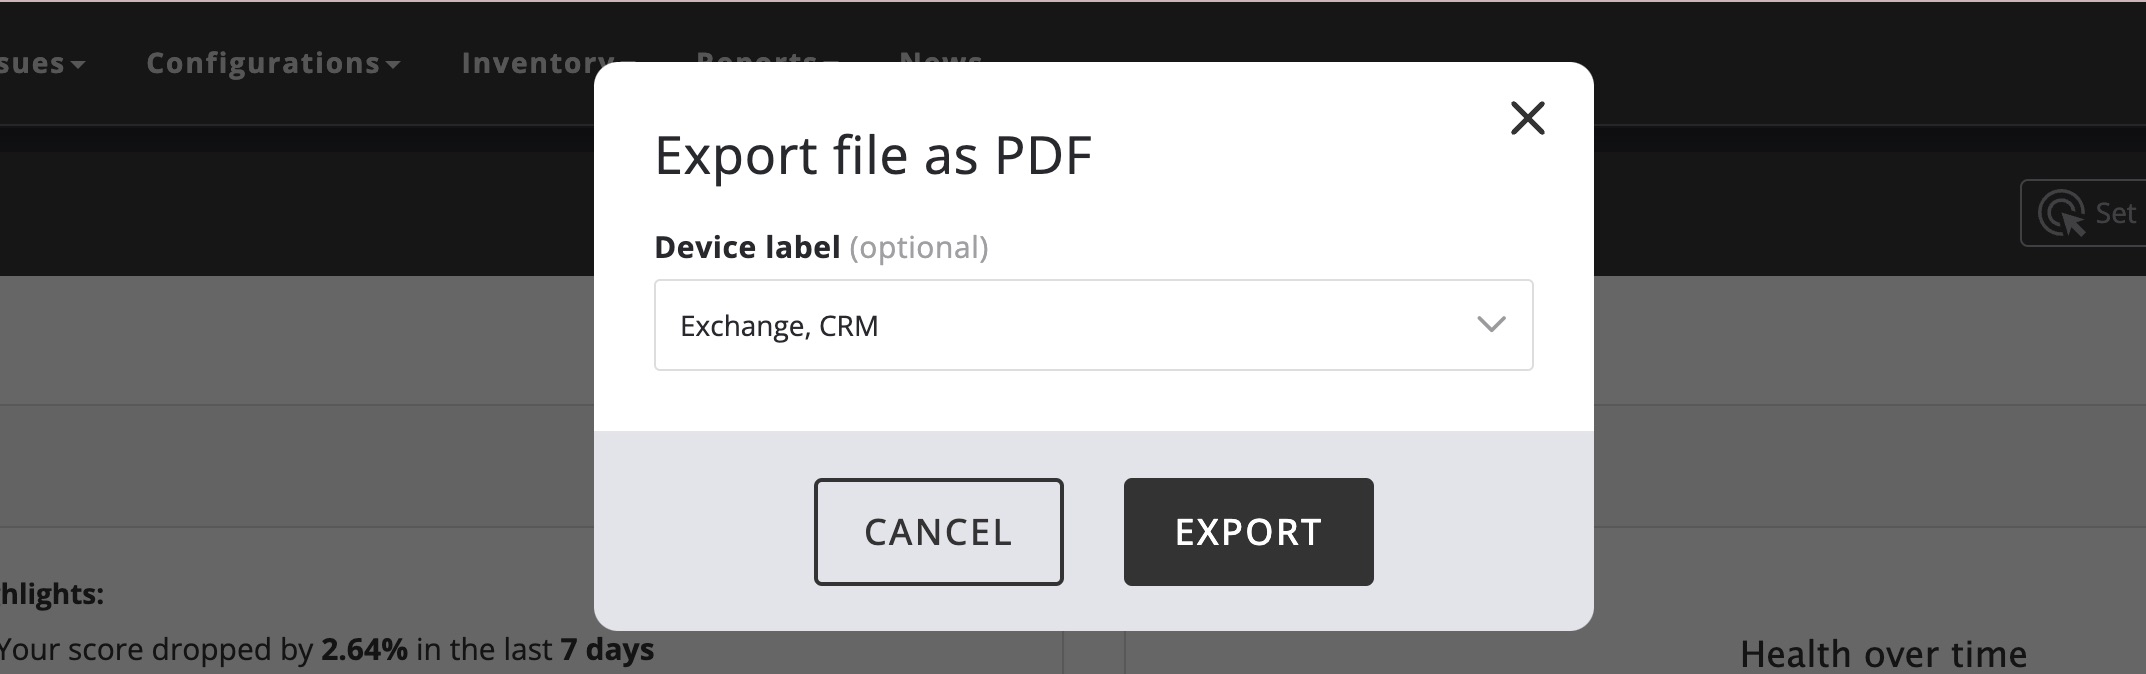
In the upcoming modal window select the asset lables you want the report be limited to (or keep it blank if you want to get everything) and press Export when finished.
This will download a PDF report and looks like in the screenshot below:
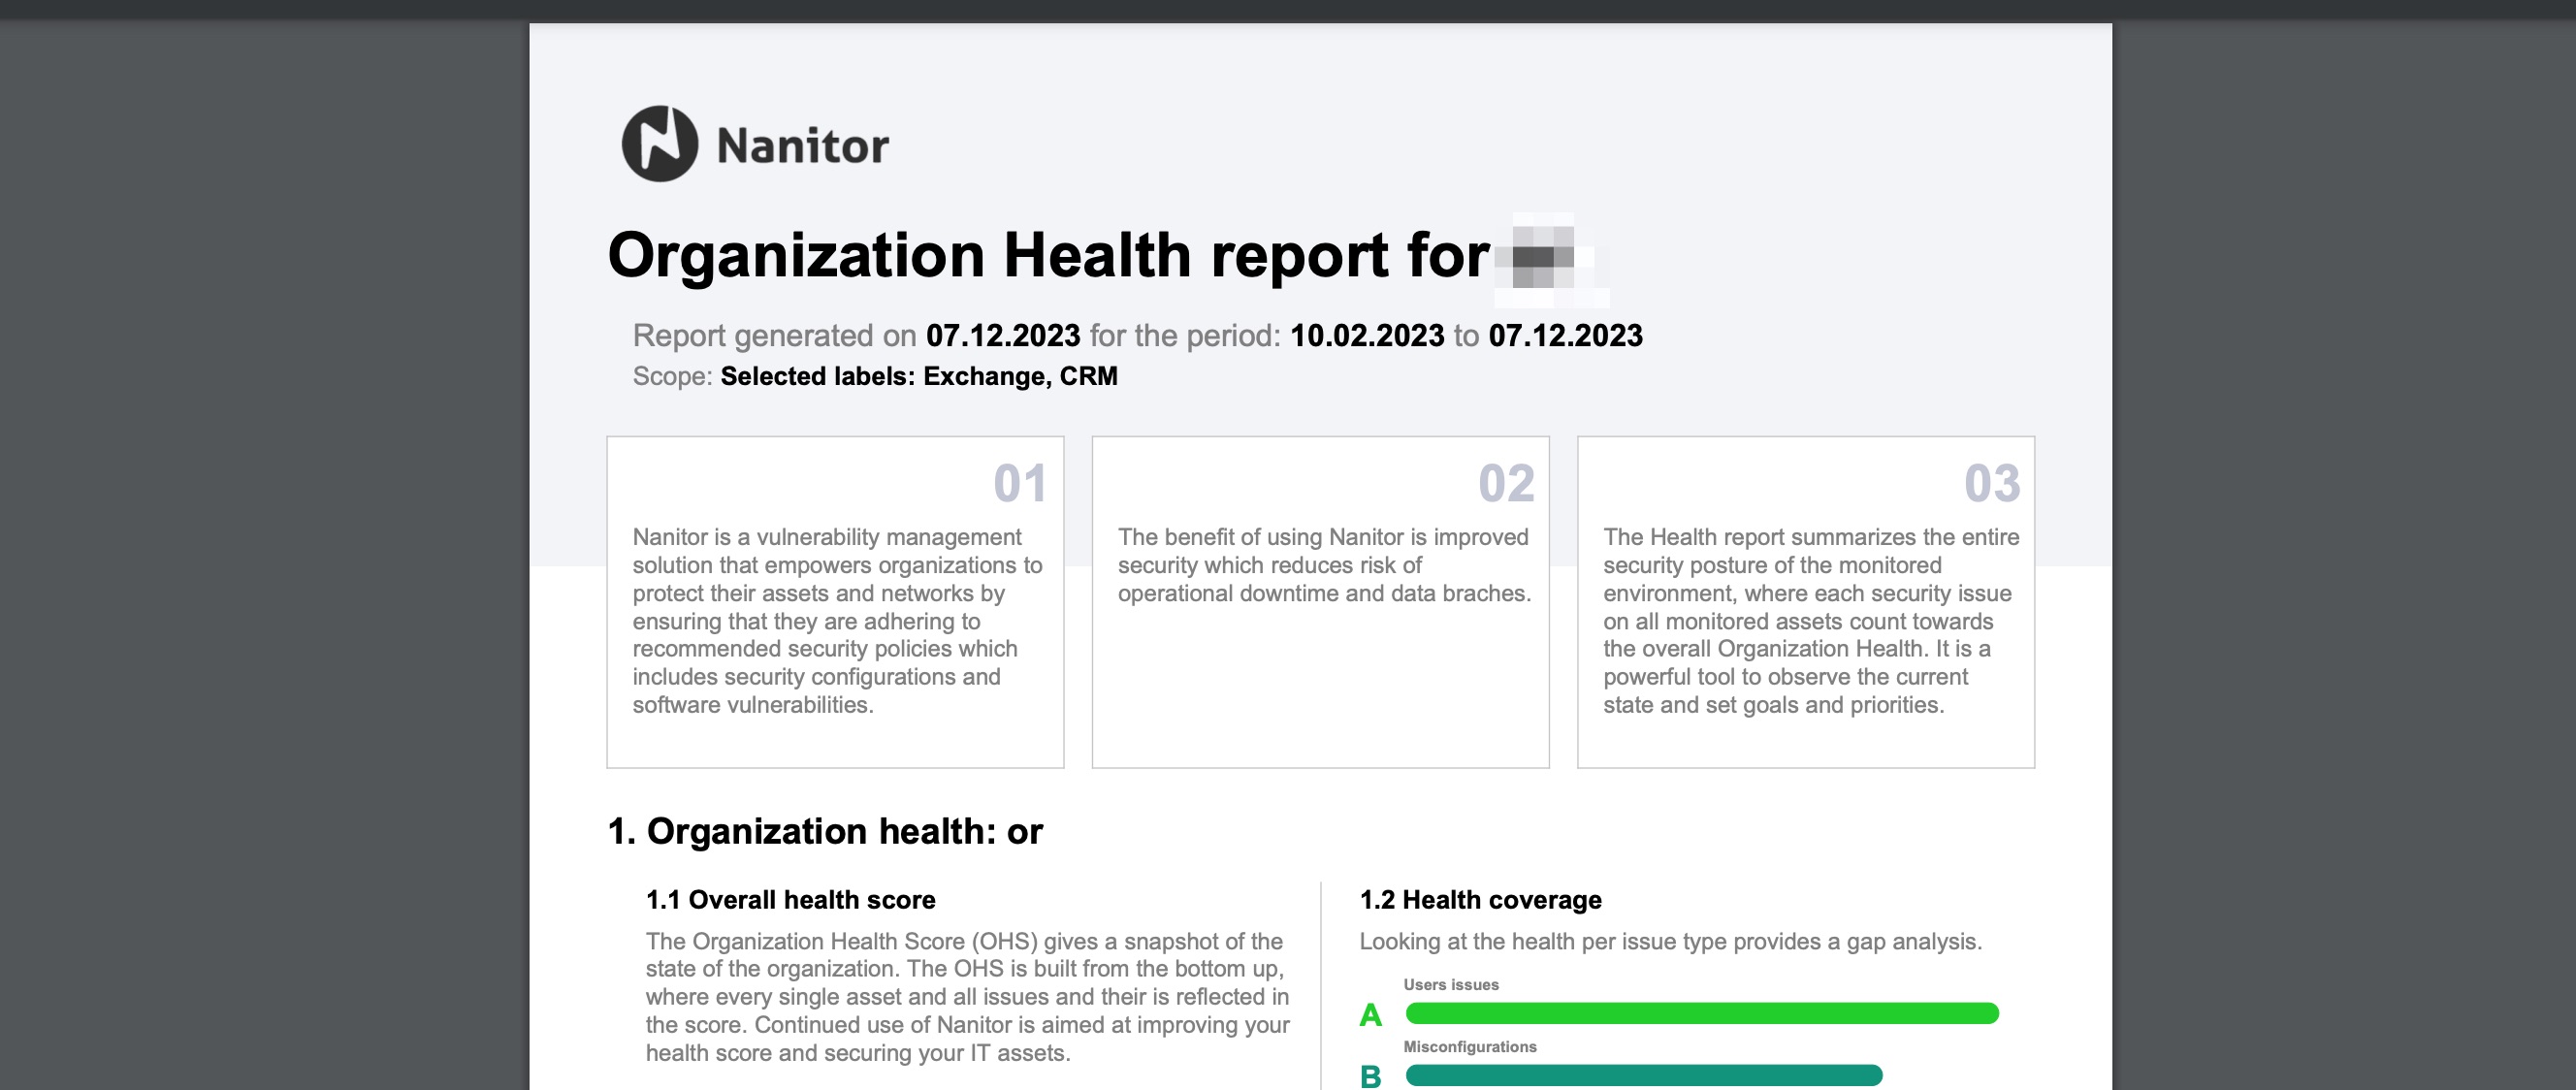
You can also let Nanitor send the health status report on a regular basis to selected team members or executices inside or outside your organization. You need to enable scheduled reporting in order to do so. From the Organization management menu select Scheduled Reports
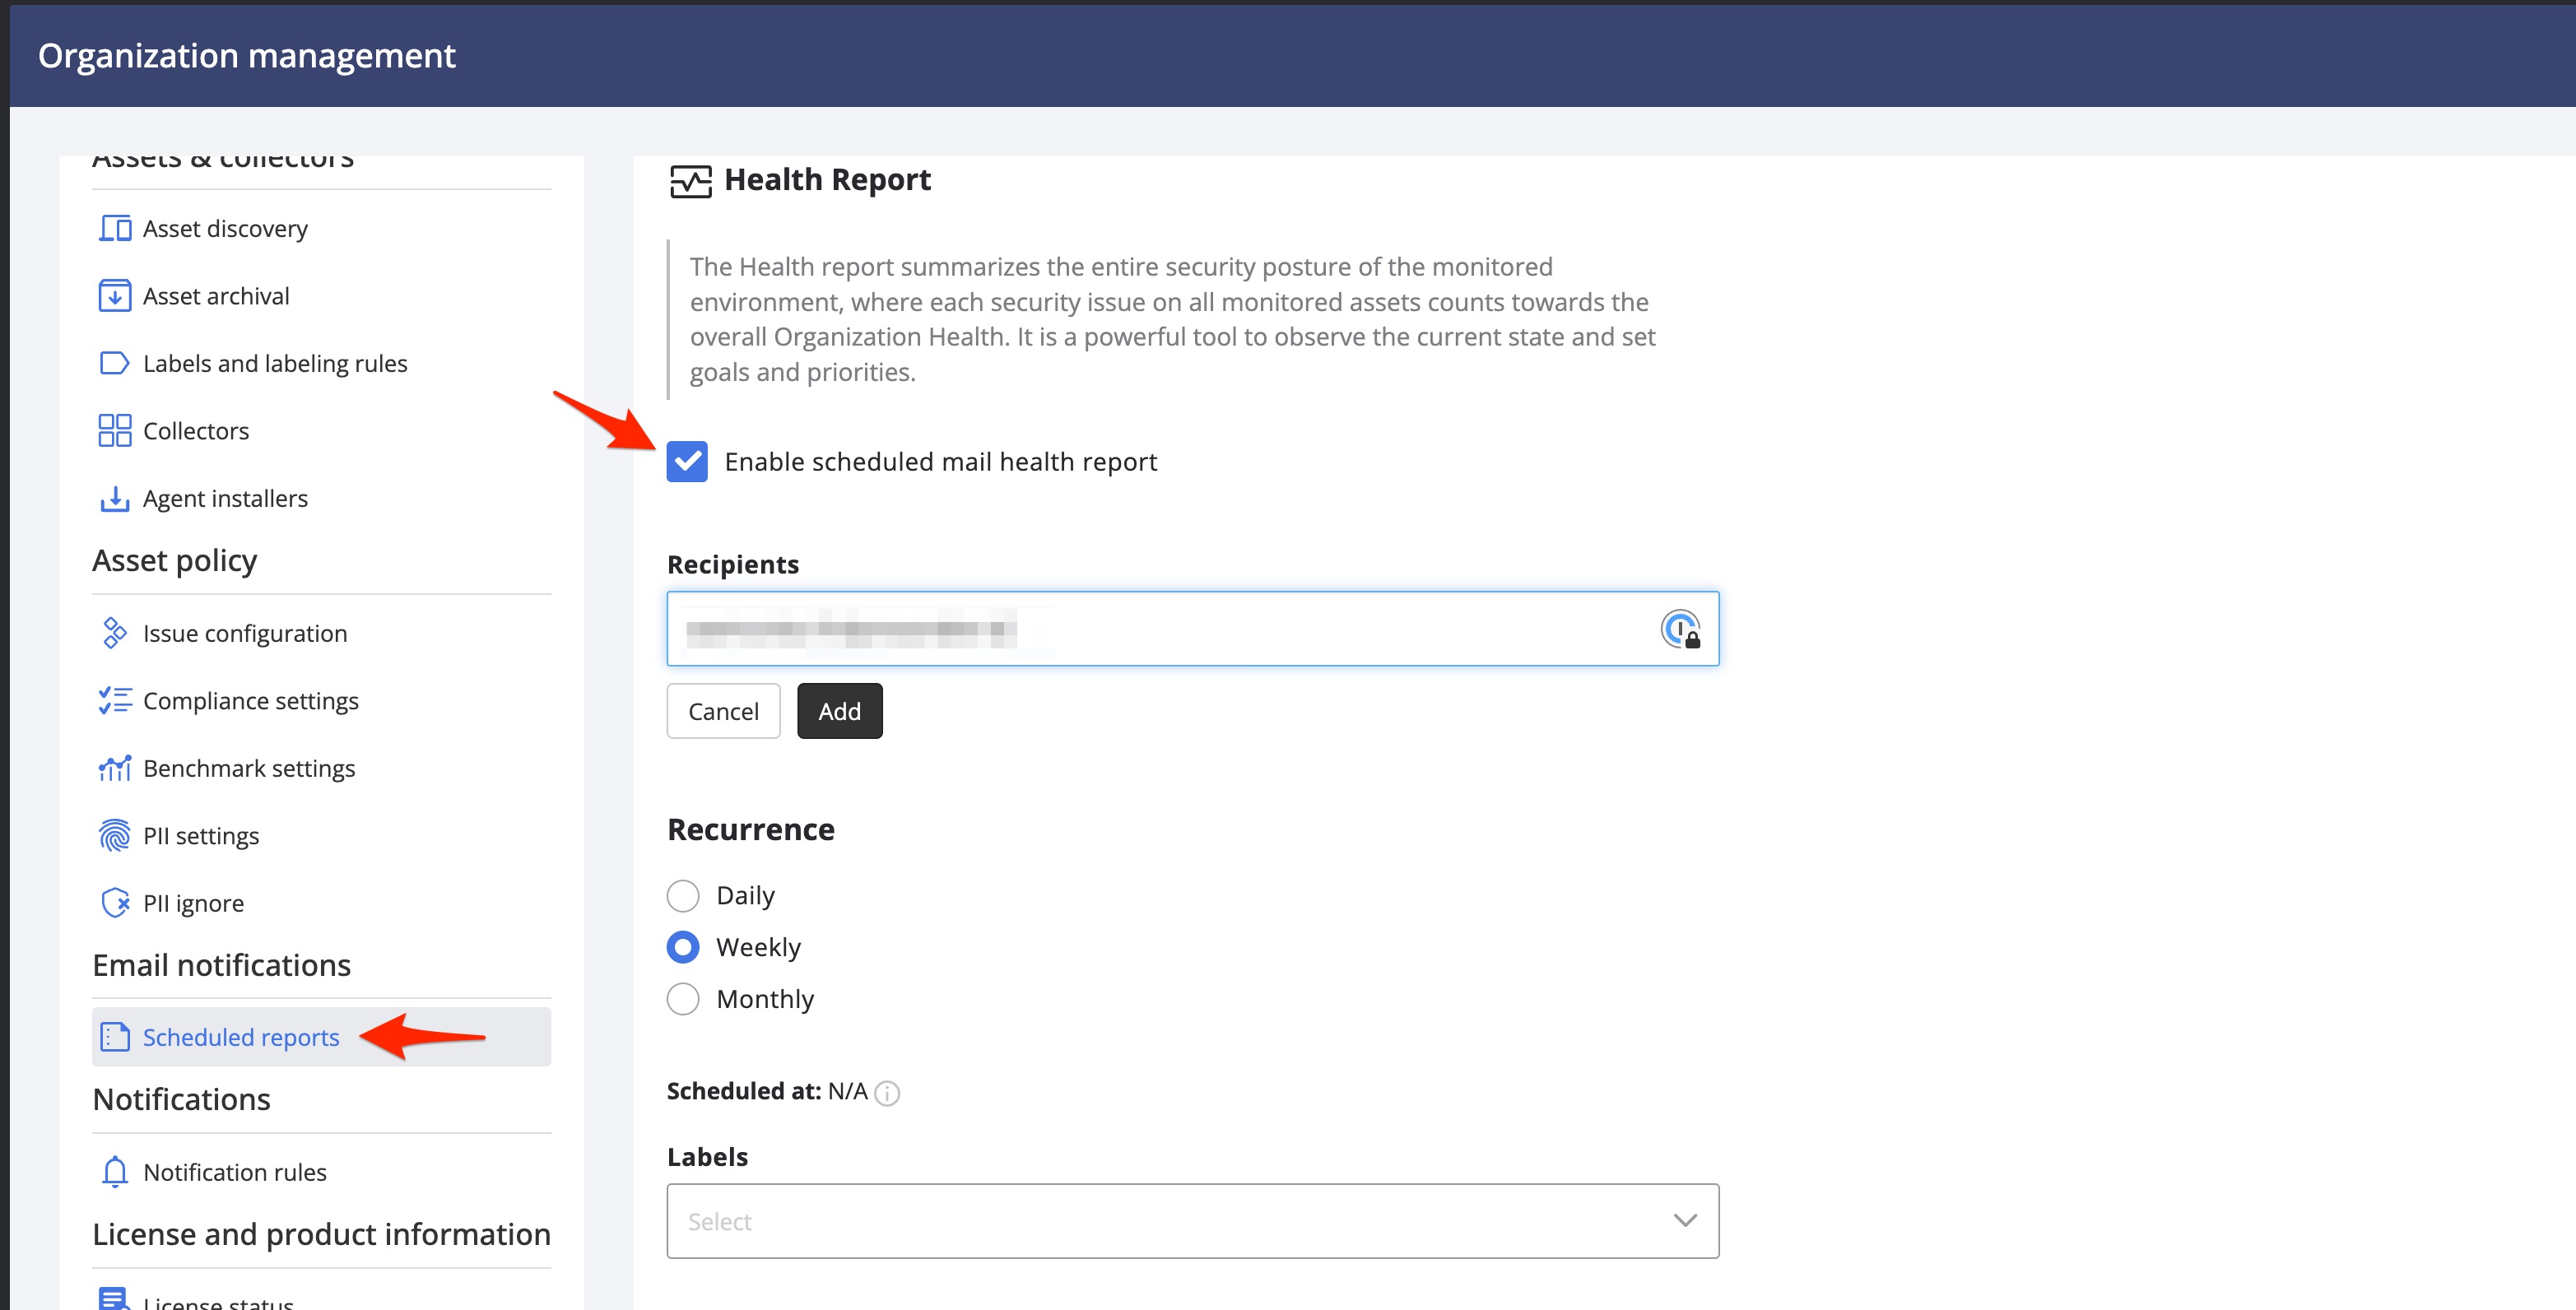
Start by enabling the scheduled report. Then you will be able to select one or more recipients, the recurrence of the report to be sent (daily, weekly or monthly) and select the asset labels you want the report limited to. Leave the asset labels field blank if you want all assets be in the scope of the report. Save your settings when finished.
Note
When you run Nanitor in a self-hosted environment you need to have an email server configured for the scheduling feature to work.
Asset Detail and Asset Inventory (pages)
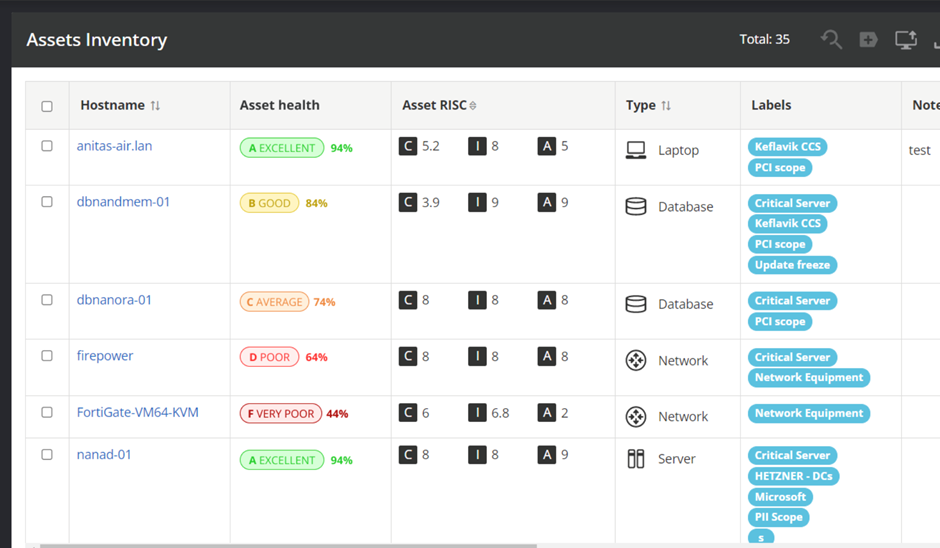
The AHS of each asset is shown both in the Asset Inventory lists and in the Asset Detail pages. For more information about that see Asset detail health scores and Asset inventory page.