Leveraging Nanitor as a vulnerability management tool
Nanitor lets you efficiently manage vulnerabilities. Detected issues will get prioritized so you can focus on the most important things and areas where you want to improve. Nanitor focuses on handling the configurations correctly and effectively presenting the information. This means that Nanitor does not require special operational training and anyone can use the system.
Inviting team members as users
You can't do it by yourself. IT security is a team effort that requires awareness and focus. Using Nanitor as a collaboration tool to communicate with others on what detected issues have been already reviewed and having visibility on what remediation projects are ongoing or going to be addressed in the nearest future is essential to align efforts across teams.
Sharing the Nanitor experience and insights with your colleagues and among other teams or departments is easy. You can create as many users as needed and divide them into read-only and administrator access roles. Nanitor will send invitation emails to you.
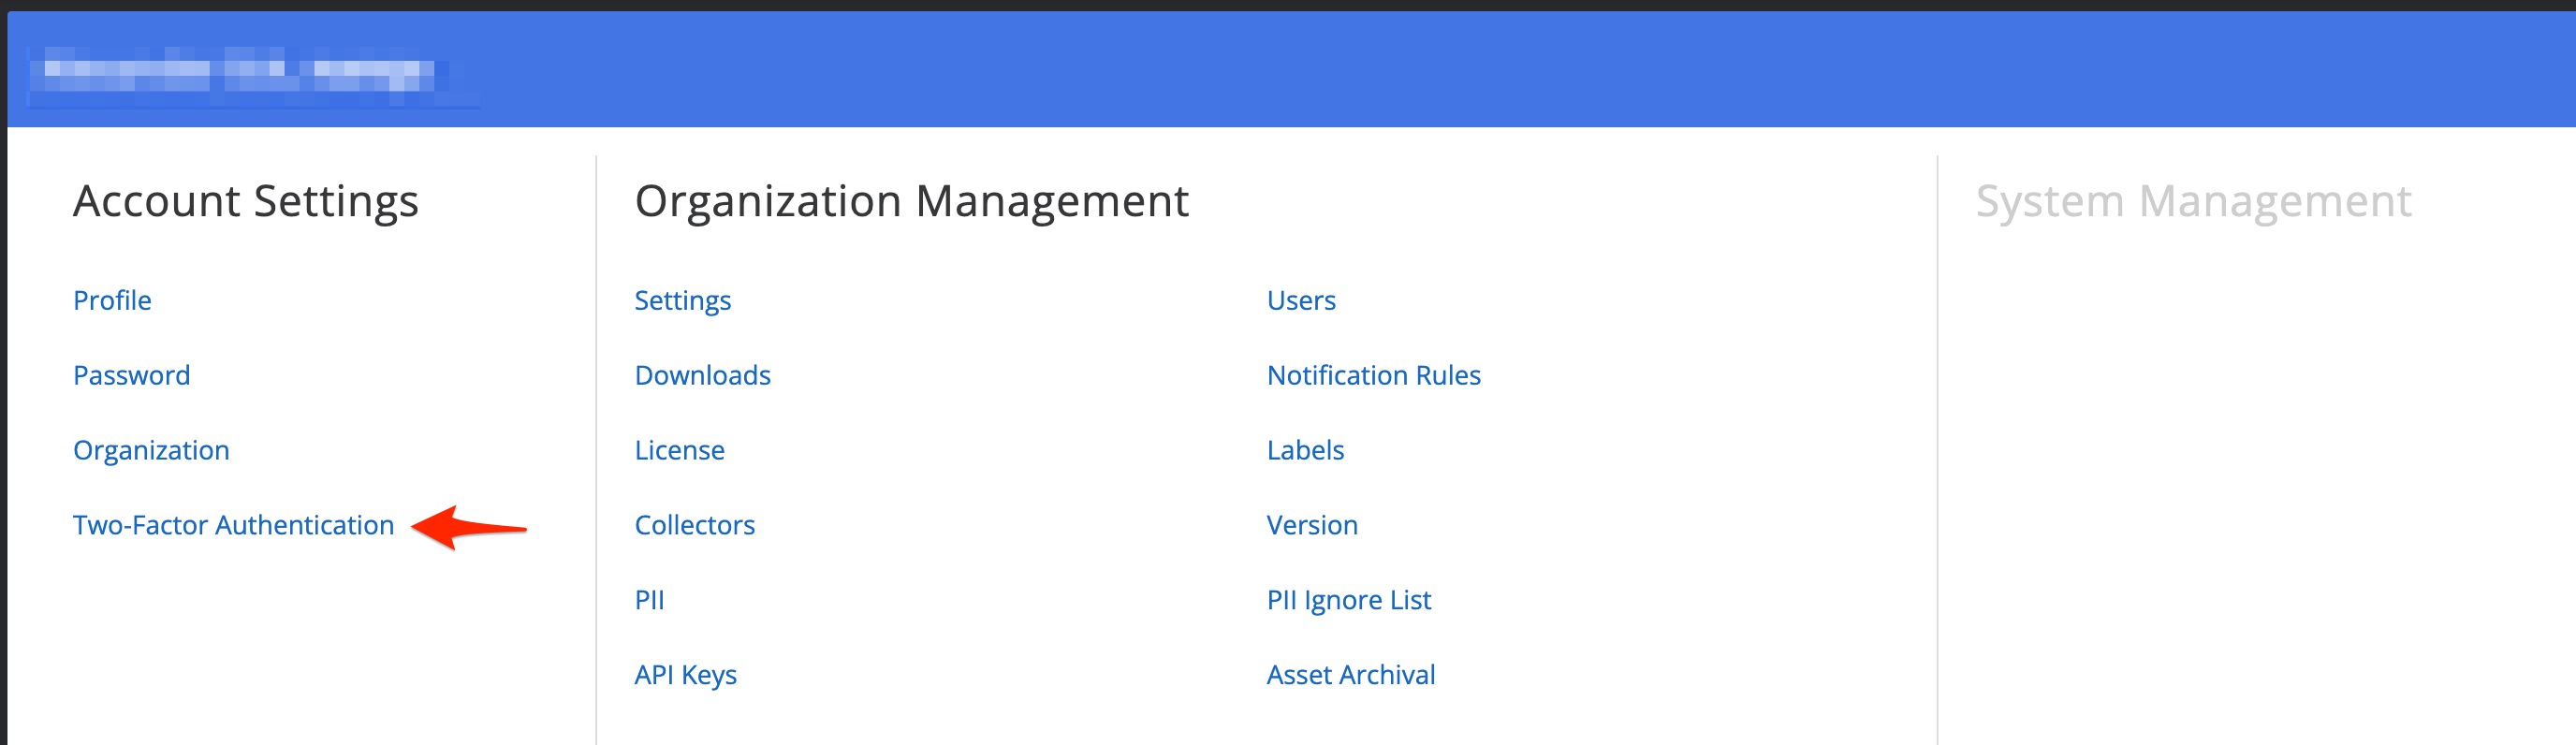
Nanitor can be used with local users or integrated into your existing user management application (SAML). Two-factor authentication (MFA) as the best practice for securiting your Nanitor instance can and should always be enabled. That can be achieved from the account settings menu.
Setting asset priorities
Your assets will appear in Nanitor after the installation of the clients. Before Nanitor can provide you with insightful and weighed results you will need to prioritize your assets. Prioritizing assets is done by tagging your assets with labels in Nanitor. You (or your team) will need to do a C-I-A (confidentiality, integrity, and availability) rating per label and assign one or more labels to your asset fleet. Labels are also used for reporting to ensure that you can track what is important for your organization. Further assistance on labeling your asset fleet can be found in our best practices labeling guide.
Installing assets
To gather information into Nanitor you will need our agents to be installed on your machines. The agent can easily be installed on any PC, Mac, and Server. The installation process depends on the platform. Refer to the agent section in our documentation to get the correct installation guides.
To gather configuration information from network devices, databases, and Cloud infrastructures you will need an additional tool called the Nanitor collector. The collector package can easily be installed on a Server of your choice or an existing Nanitor agent can also serve as a collector to communicate and gather information on assets on your network that does not support an installation of an agent.
External asset discovery
Leveraging Shodan, you can discover and analyze your external attack surface, including IPs, domains, and services. It identifies external assets that are related to a specific set of defined domains. You can enable and configure this feature from Organization management → Asset policy → External attack surface.
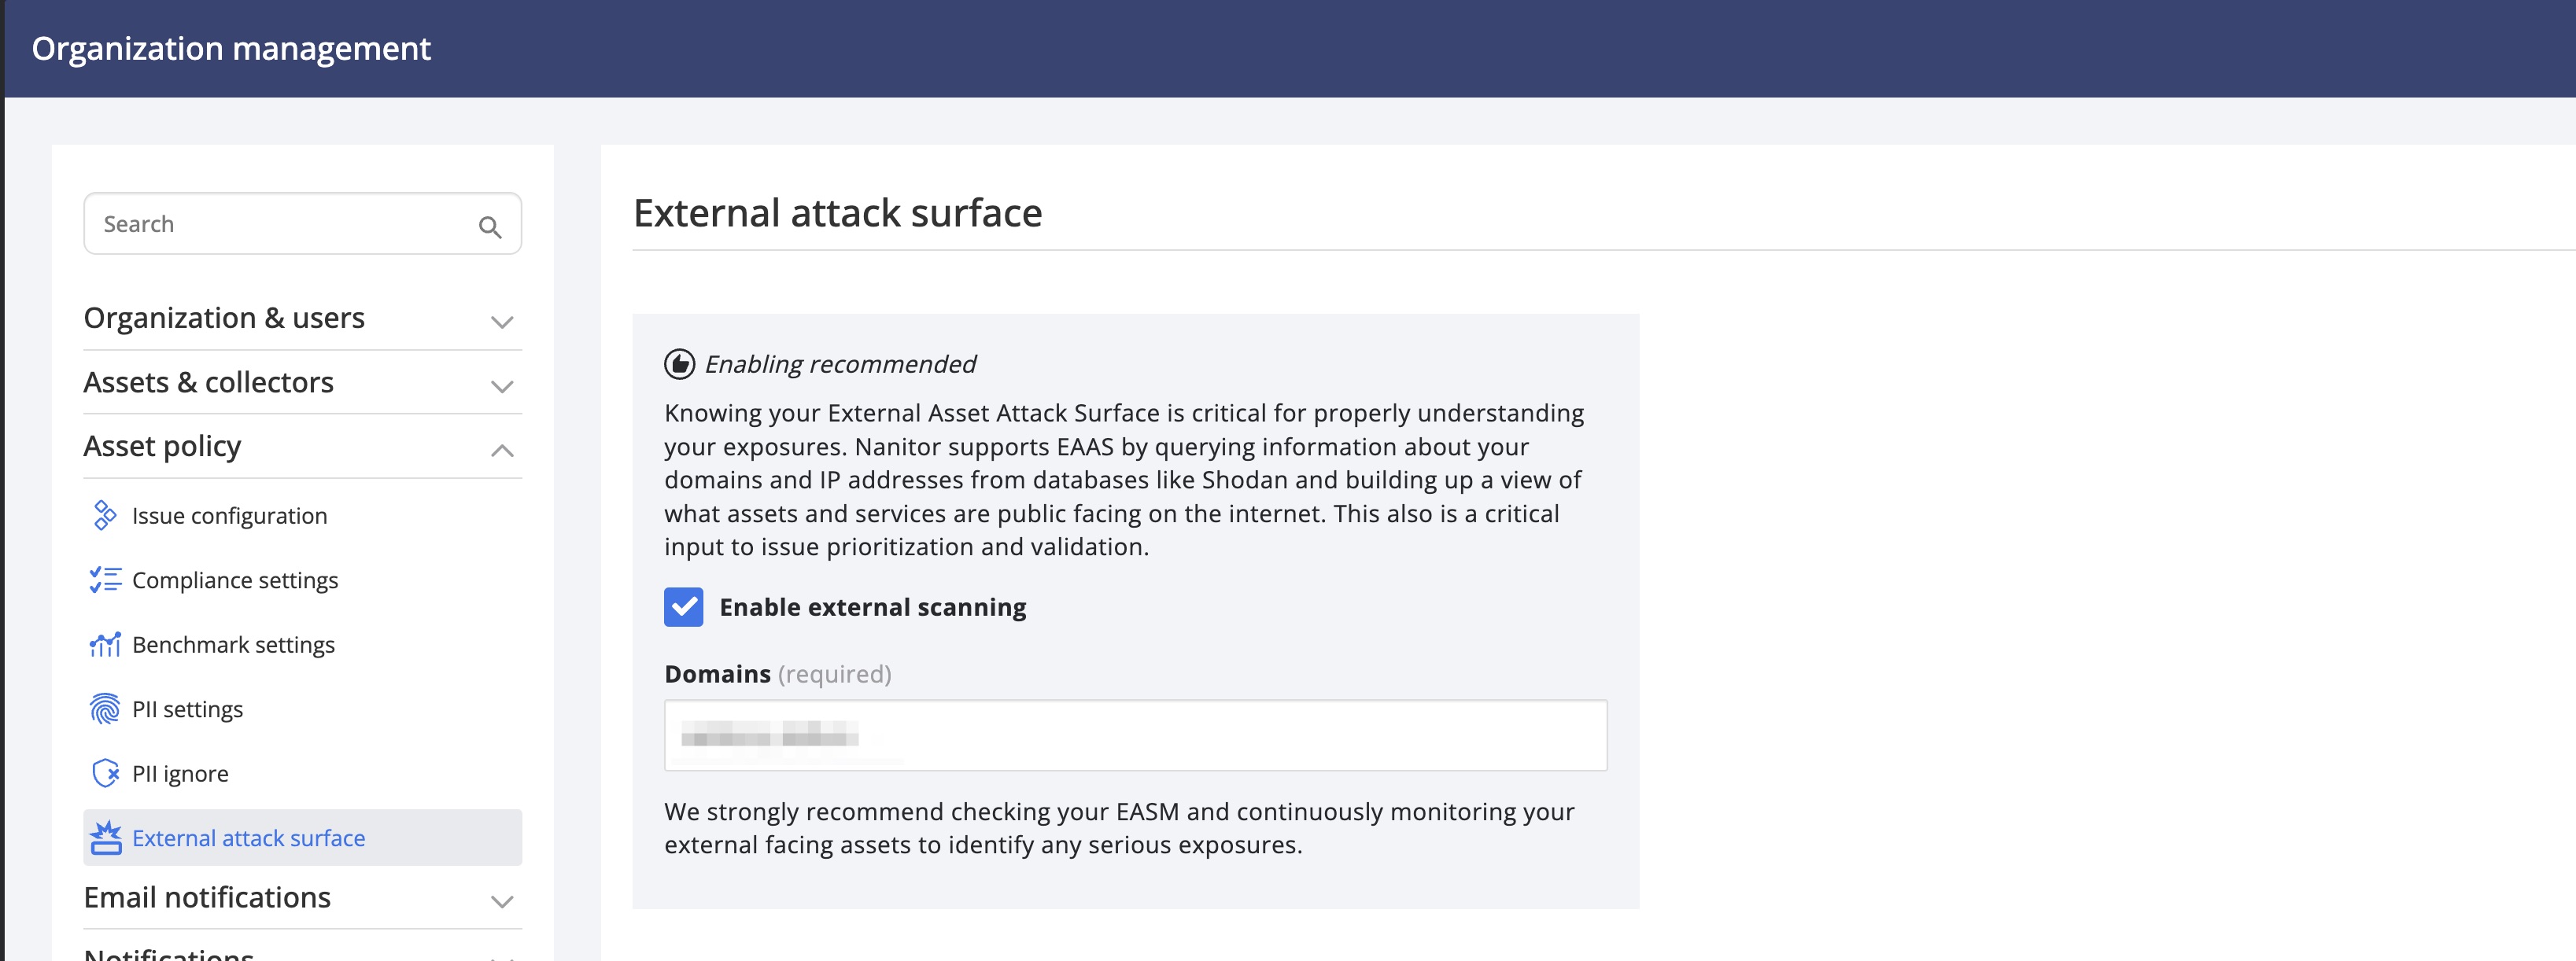
You can specify one or multiple domains with a comma separated list. You need to confirm the ownership of the domain(s) and their authority to look up and view asset information from those domains. Shortly after confirmation, external assets should start showing up under the Assets Inventory. You can filter on them by leveraging the External filter option.
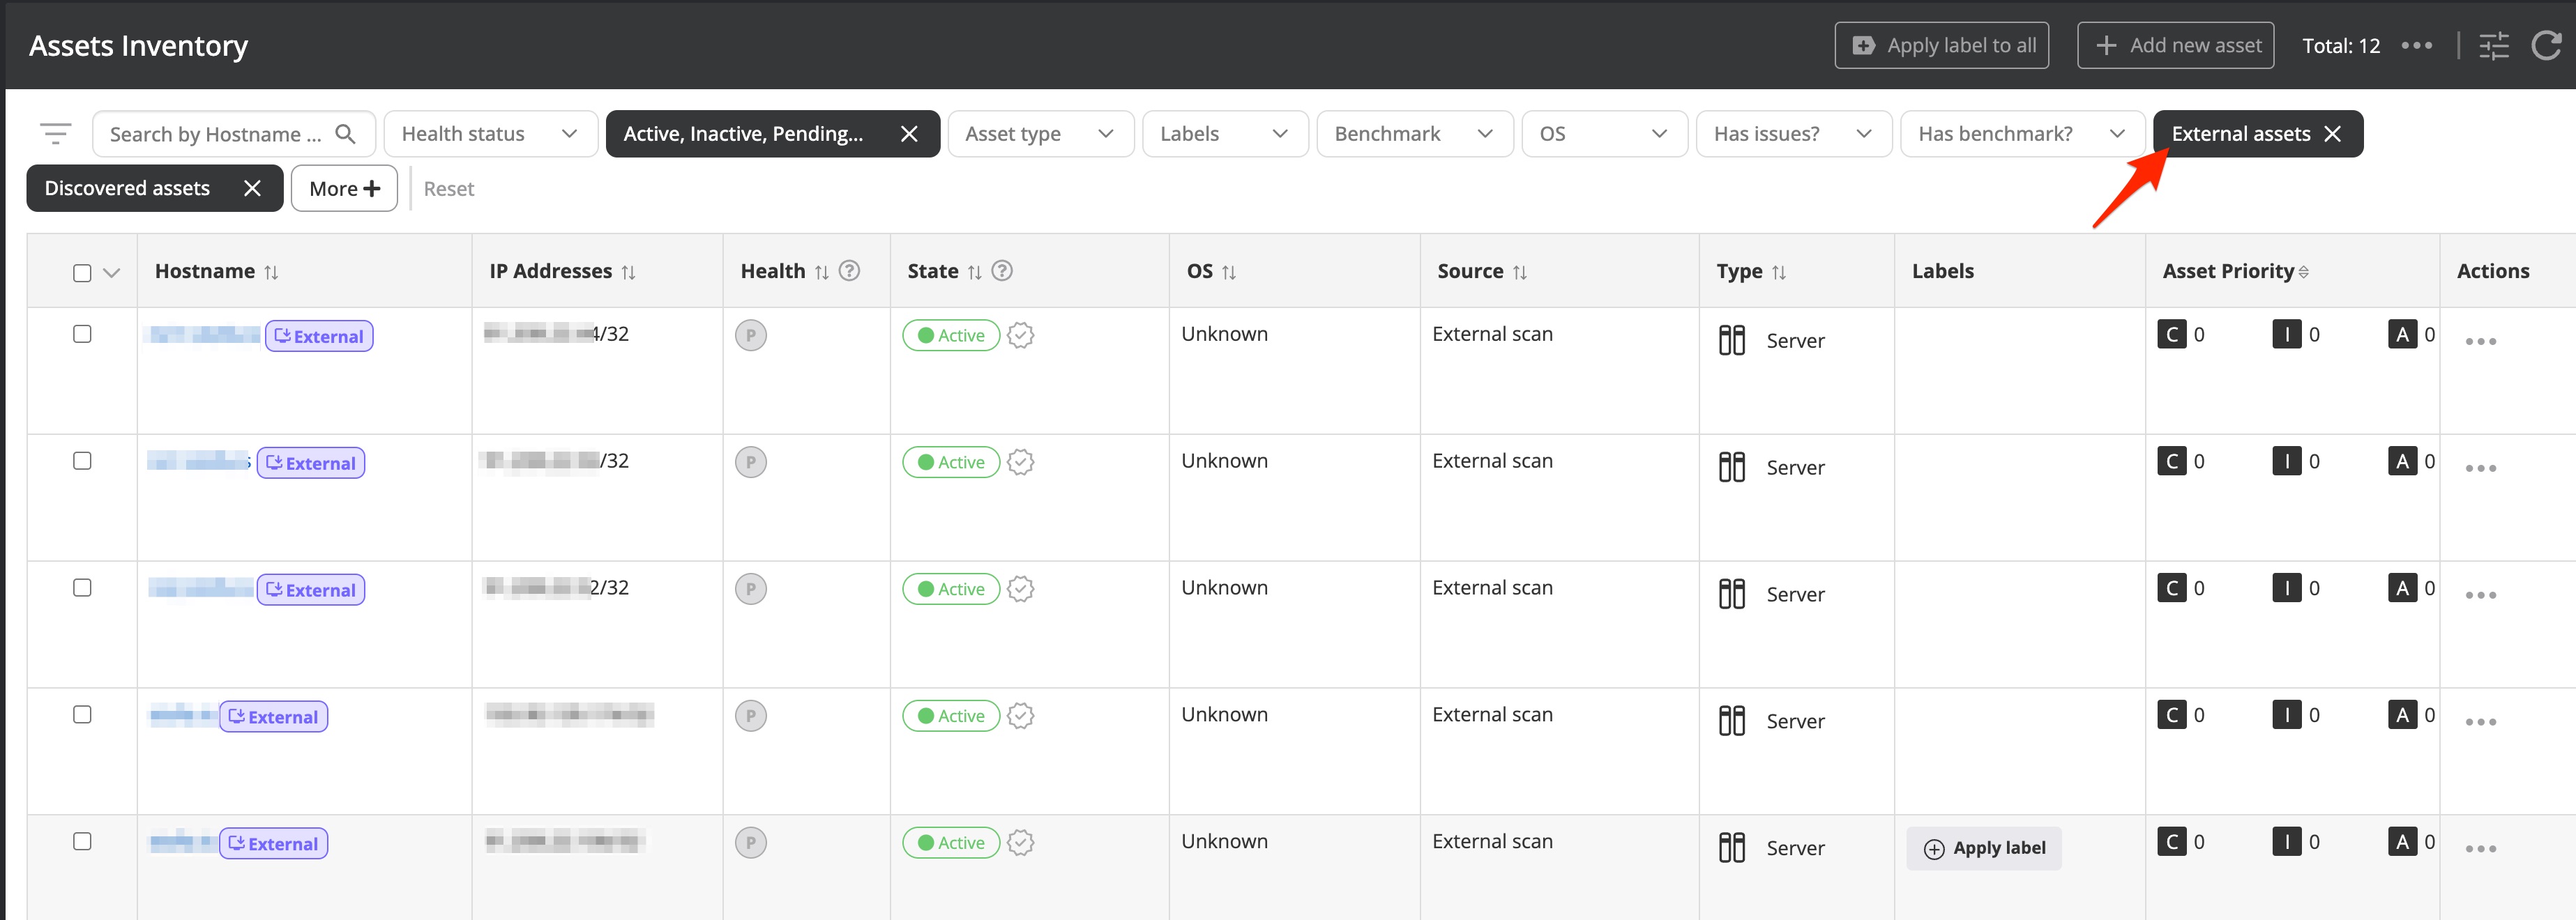
The check is repeated daily. Note that if assets are persistently detected for over 3 days then open ports will be shown in the Asset details to help identify services running and potential vulnerabilities. We recommend going through the list of identified external assets and verifying that those should be available externally. Further, it can be helpful to verify that the assets are behind a web application firewall and not directly exposed to the internet.
Adjusting your technical security policies
Once Nanitor collected all the configuration settings from the assets, Nanitor will compare the configuration settings against the rule set issued by the Center of Internet Security (CIS) which is considered the best practice for configuring IT assets. The rule set provided by CIS is considered the perfect world. The challenge for each IT apartment is to adjust the configuration requirements from CIS to a level that is suited for each business, maintainable and practicable. Nanitor is taking a first step in this direction by excluding certain rules (not in the baseline) and applying severity to each rule. Still, there is work remaining to adjust the benchmark rule set which can be considered as the technical policy that you want to follow for your organization. However, the benchmark rule set deployed by Nanitor is a very good starting point, and following the instructions to remediate misconfigured assets will improve your IT resiliency significantly.
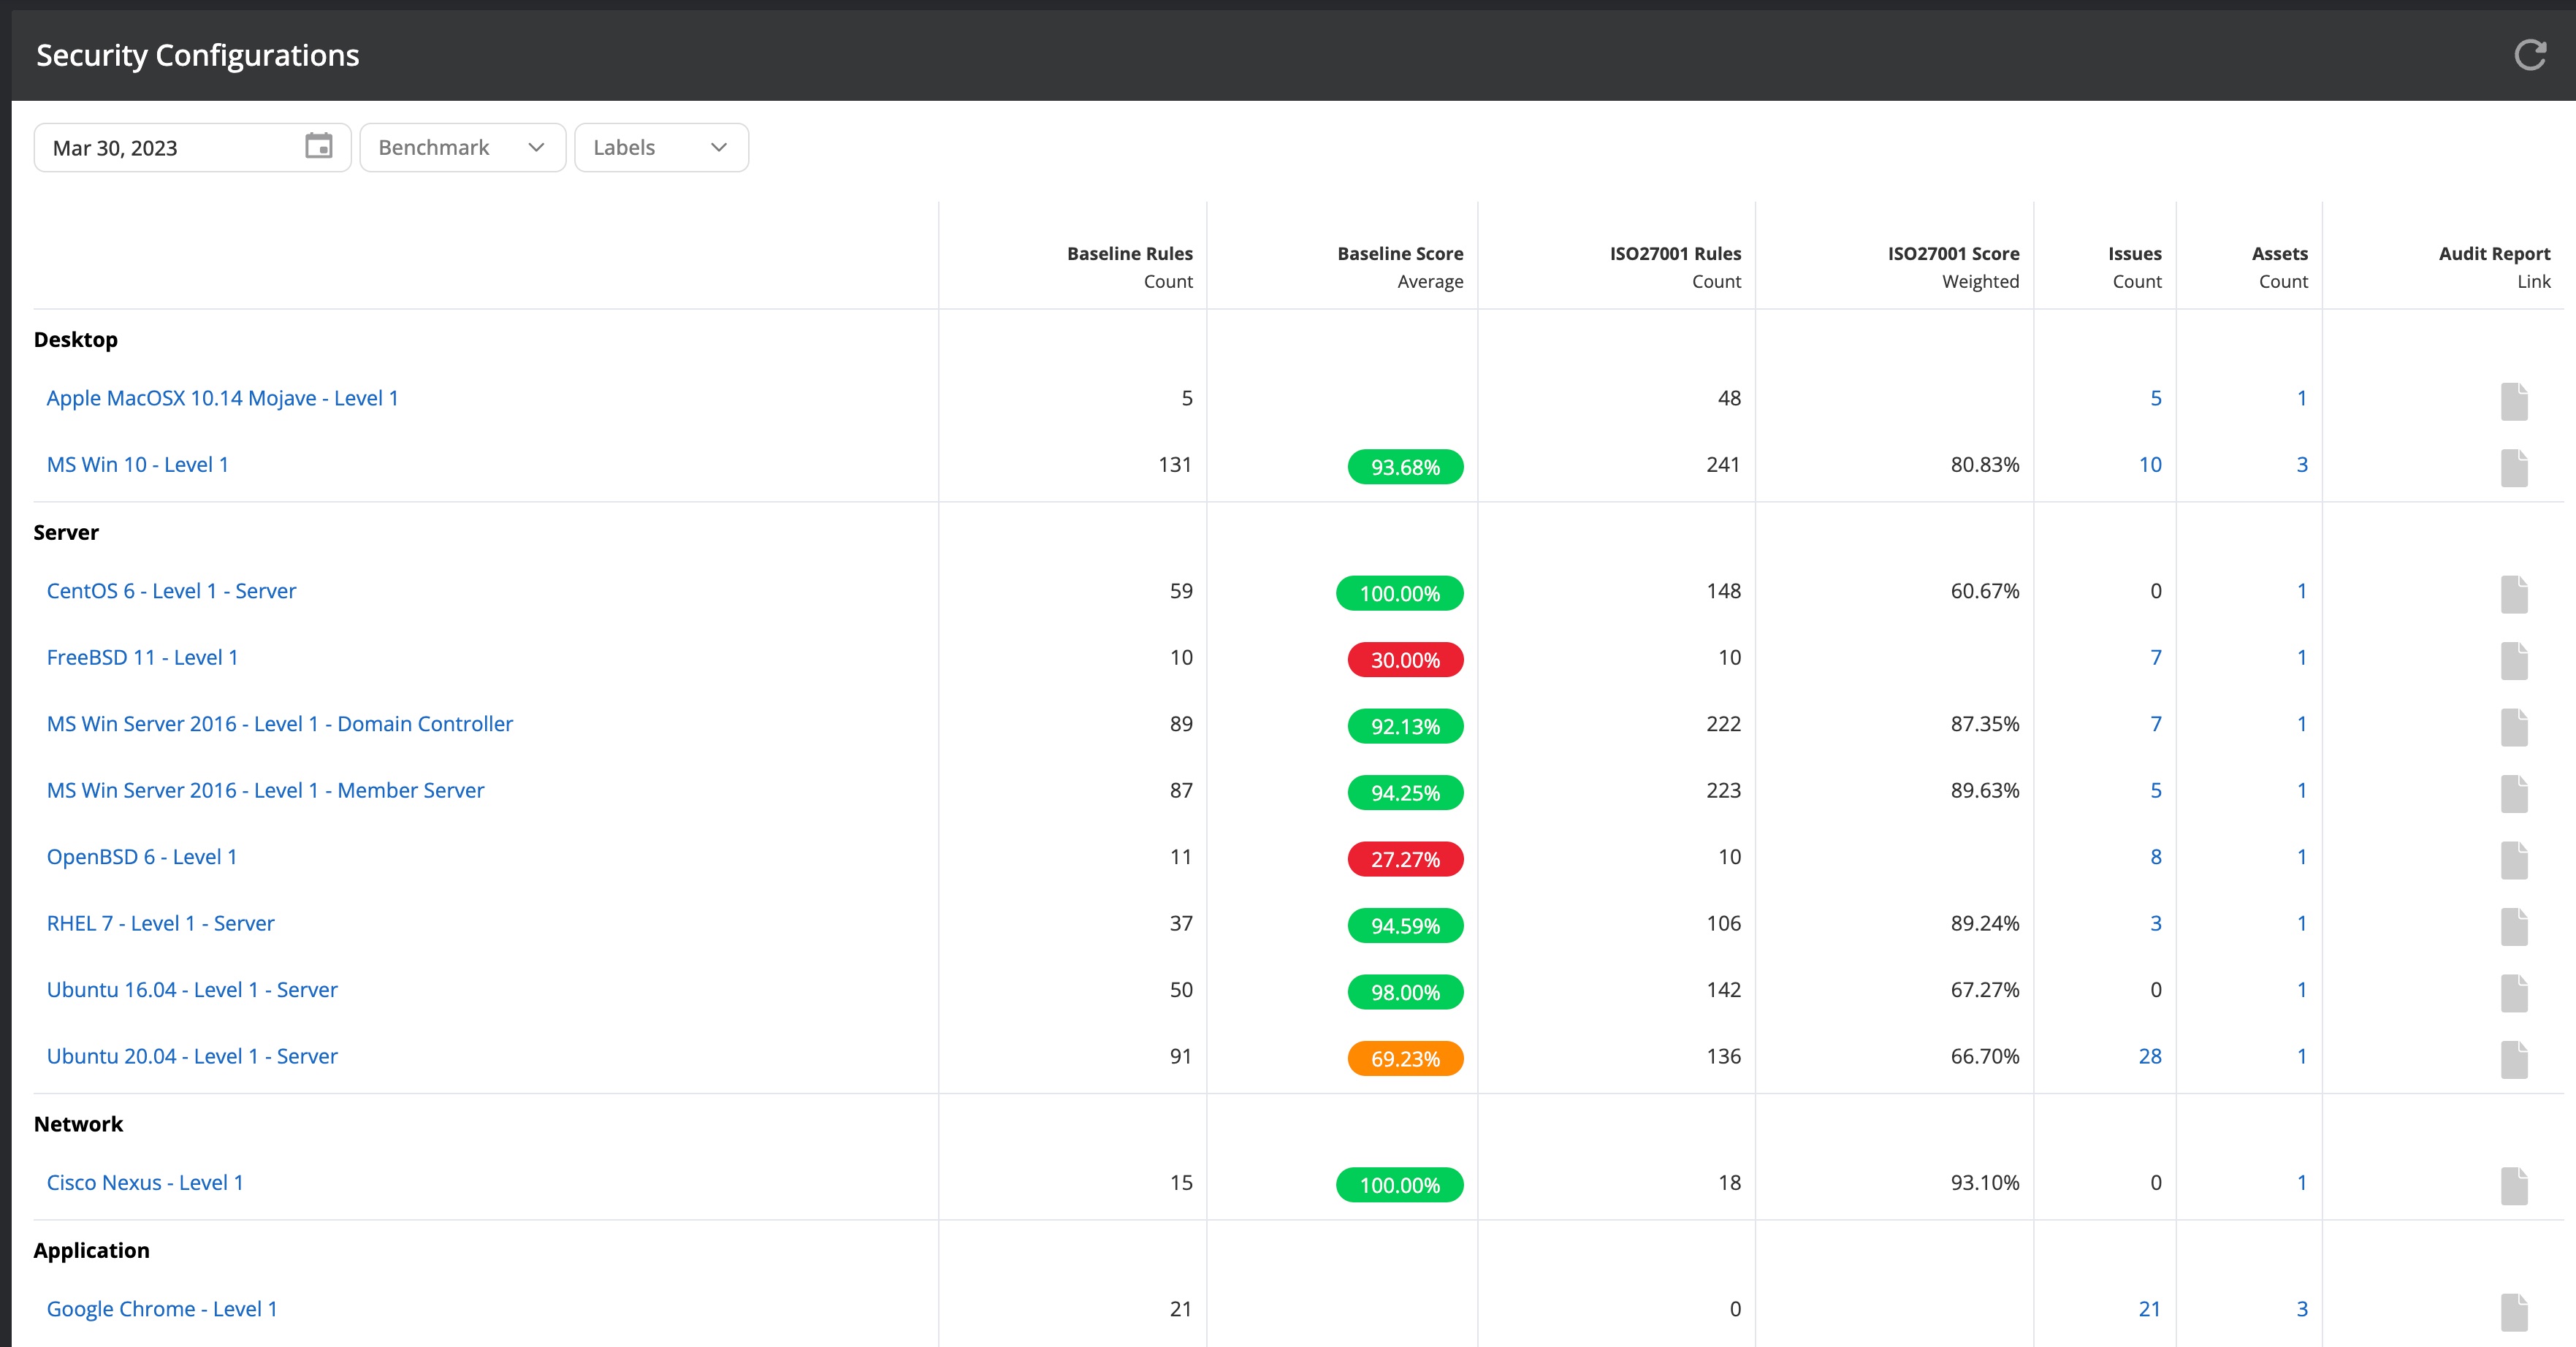
From the Configurations page (on the left in the Nanitor menu bar) you will see a list of populated benchmarks that have been detected by Nanitor. Nanitor gives each asset a score according to how it is configured compared to the rule set. There is a baseline score and a benchmark score. The benchmark score should be considered as the perfect world while the baseline score reflects a score based on the rule set considered to be matched.
To adjust a benchmark click on the benchmark on the configuration page. Take off all filters from your benchmark to list all items (the default filtering only shows items included in the baseline).
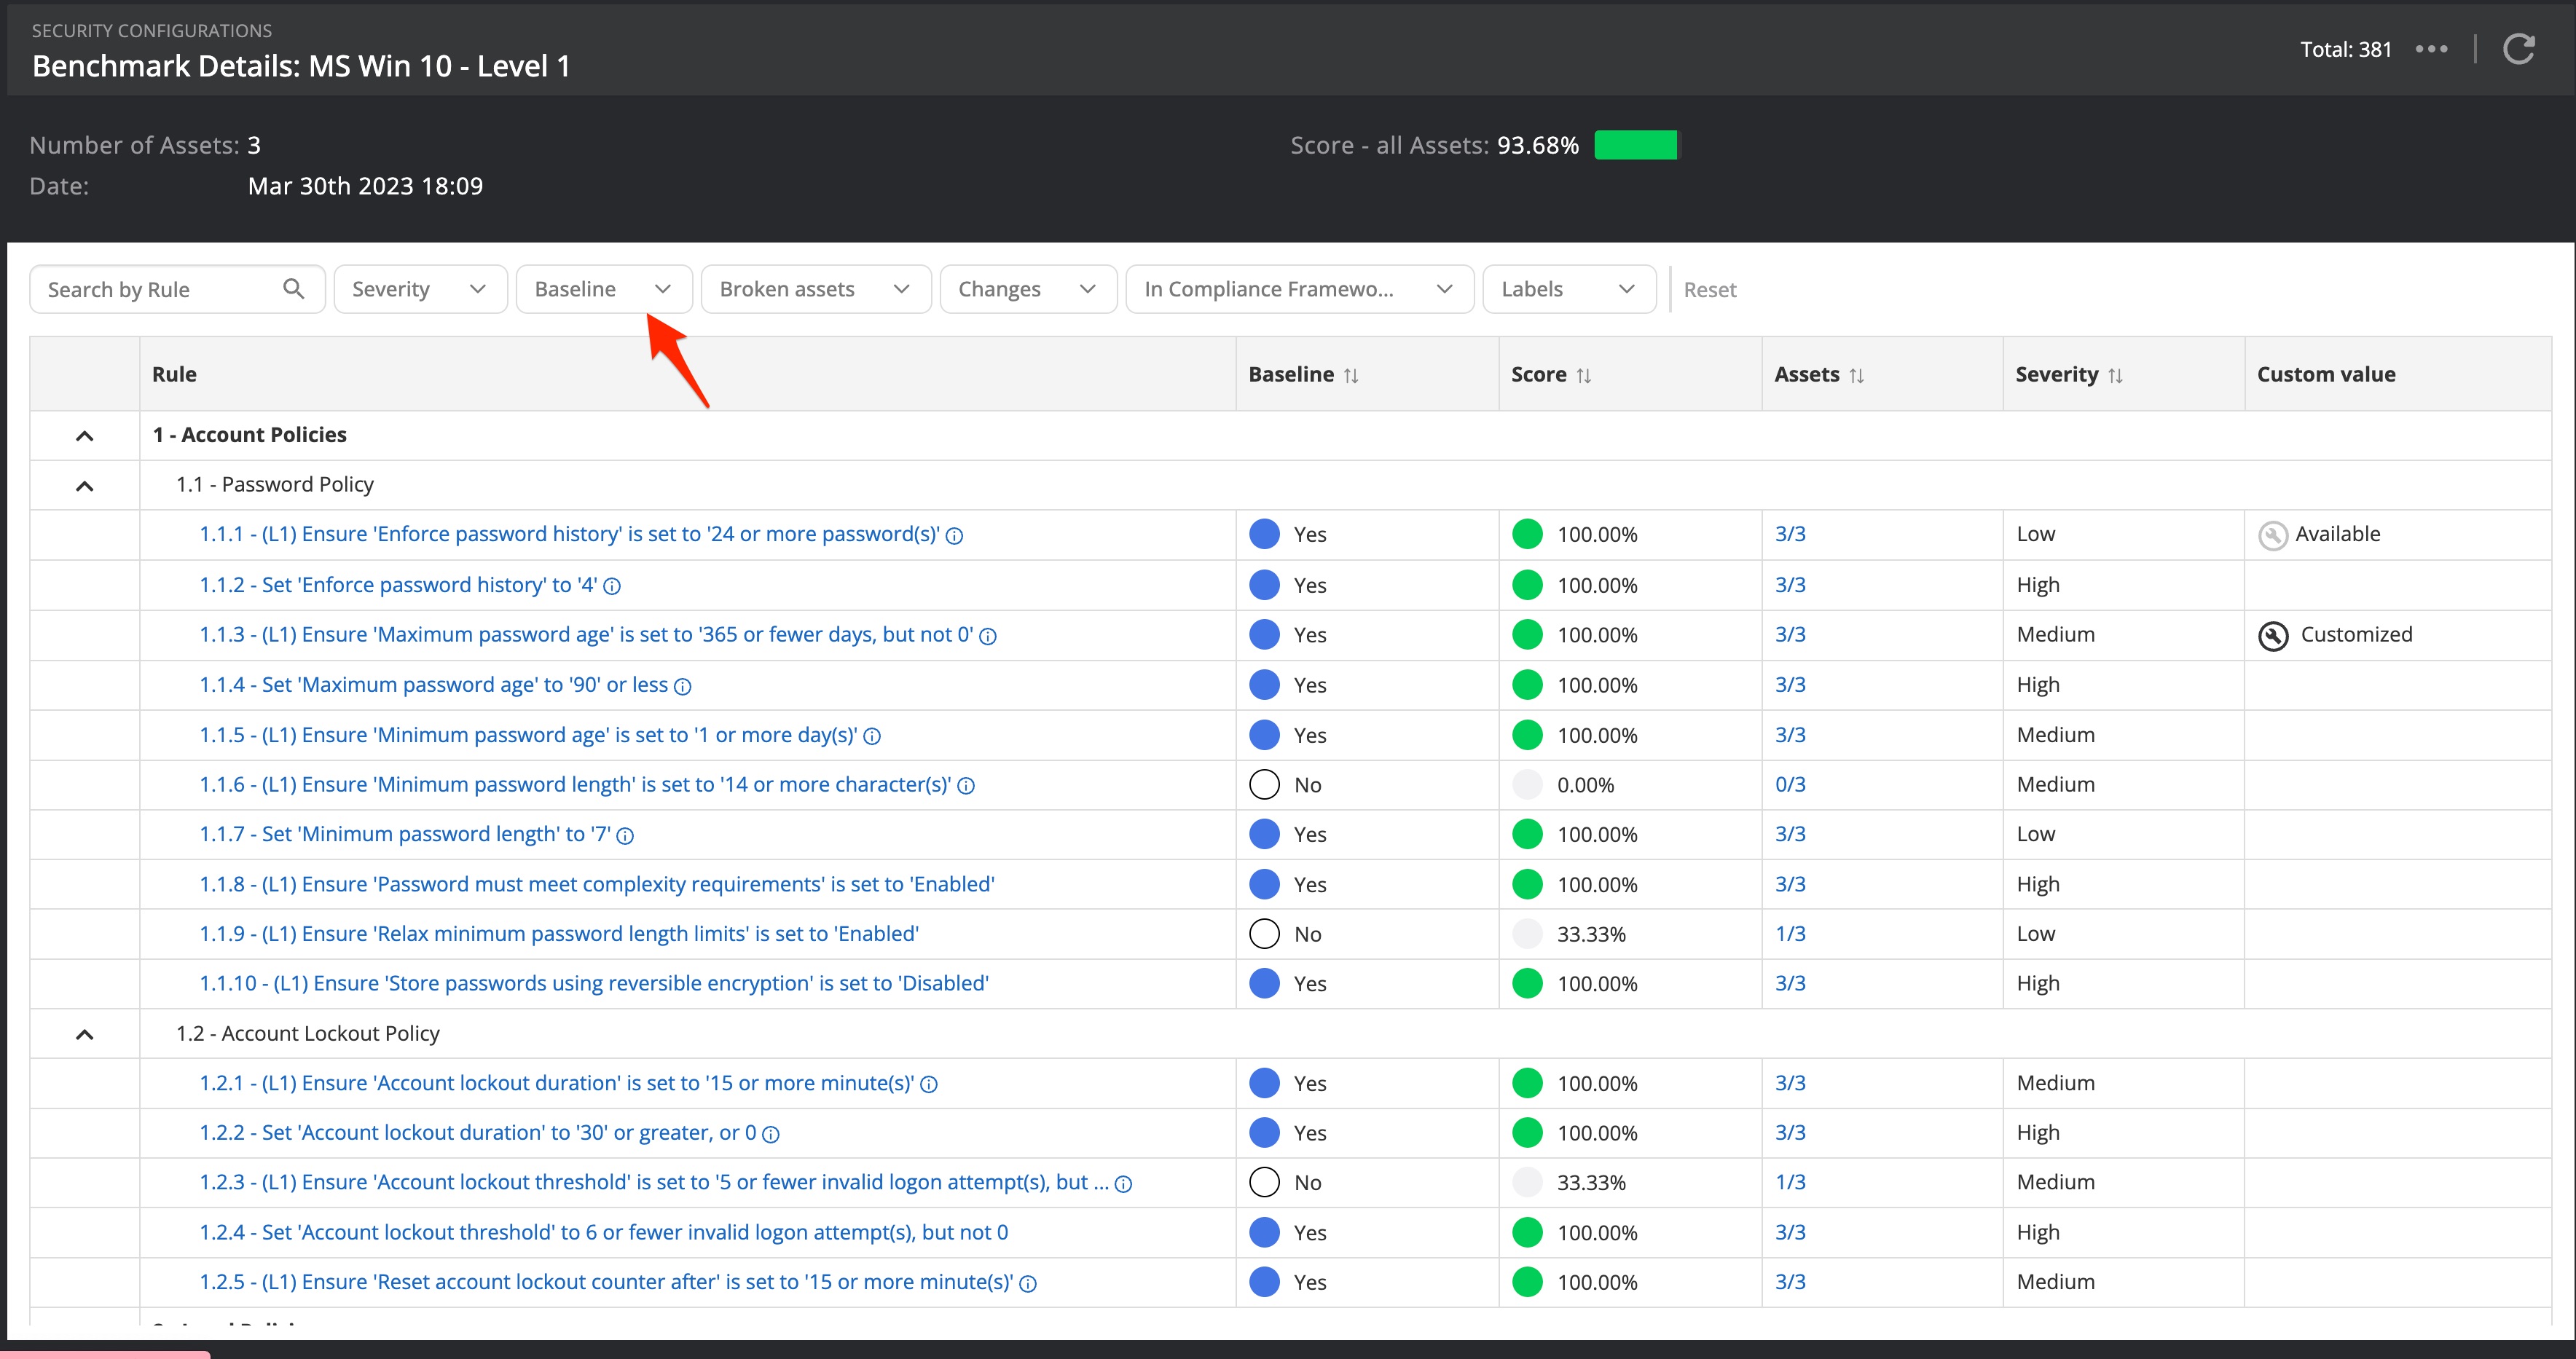
The list will show you the name of the benchmark item if it is included in the baseline (yes/no), and if the check against this item has been passed (yes/no), on many assets out of how many the pass has been passed and the severity of the item. The severity is an assumption made by Nanitor. Going through a large number of benchmarks can be cumbersome and therefore it is recommended for a first iteration to:
- exclude issues with a low to medium priority from the baseline score where the passing test has failed
- add (include) issues to the baseline score where the passing test has passed
- make adjustments to the priority if needed. The priority affects the priority rating (Low: 1, Medium: 4, High: 7, Critical: 9)
Use the filters to spot those items and act on them. Items can be excluded for the complete benchmark, per asset, or label.
Finally, you should adjust
- the priority rating for the assets for each benchmark (Administration->Container Management->Settings->Benchmarks). By default, all benchmarks are rated with 5 for confidentiality, integrity, and availability.
- the scaling factor for misconfigurations (default 1) which can be adjusted under Administration->Container Management->Settings->Issues->Priority scaling factor.
Adjusting the benchmarks is truly the most time-consuming part of Nanitor since there are many rules to be checked on their relevance. For each misconfigured rule on or more assets, Nanitor will flag an issue of type misconfiguration.
But there are other things to be considered and to be aligned with your technical policies and want you to track, get notified about, and act upon detection. This can span from detecting rogue devices on your network, discovering end-of-life operating systems, tracking violations on your user privilege policy, scanning and flagging open ports, or missing, blacklisted, or mandatory software. Nanitor can be configured to detect all those various events by Nanitor administrators by navigating to organization Management -> Settings in the administration section. In the settings menu head to the Issues tab.
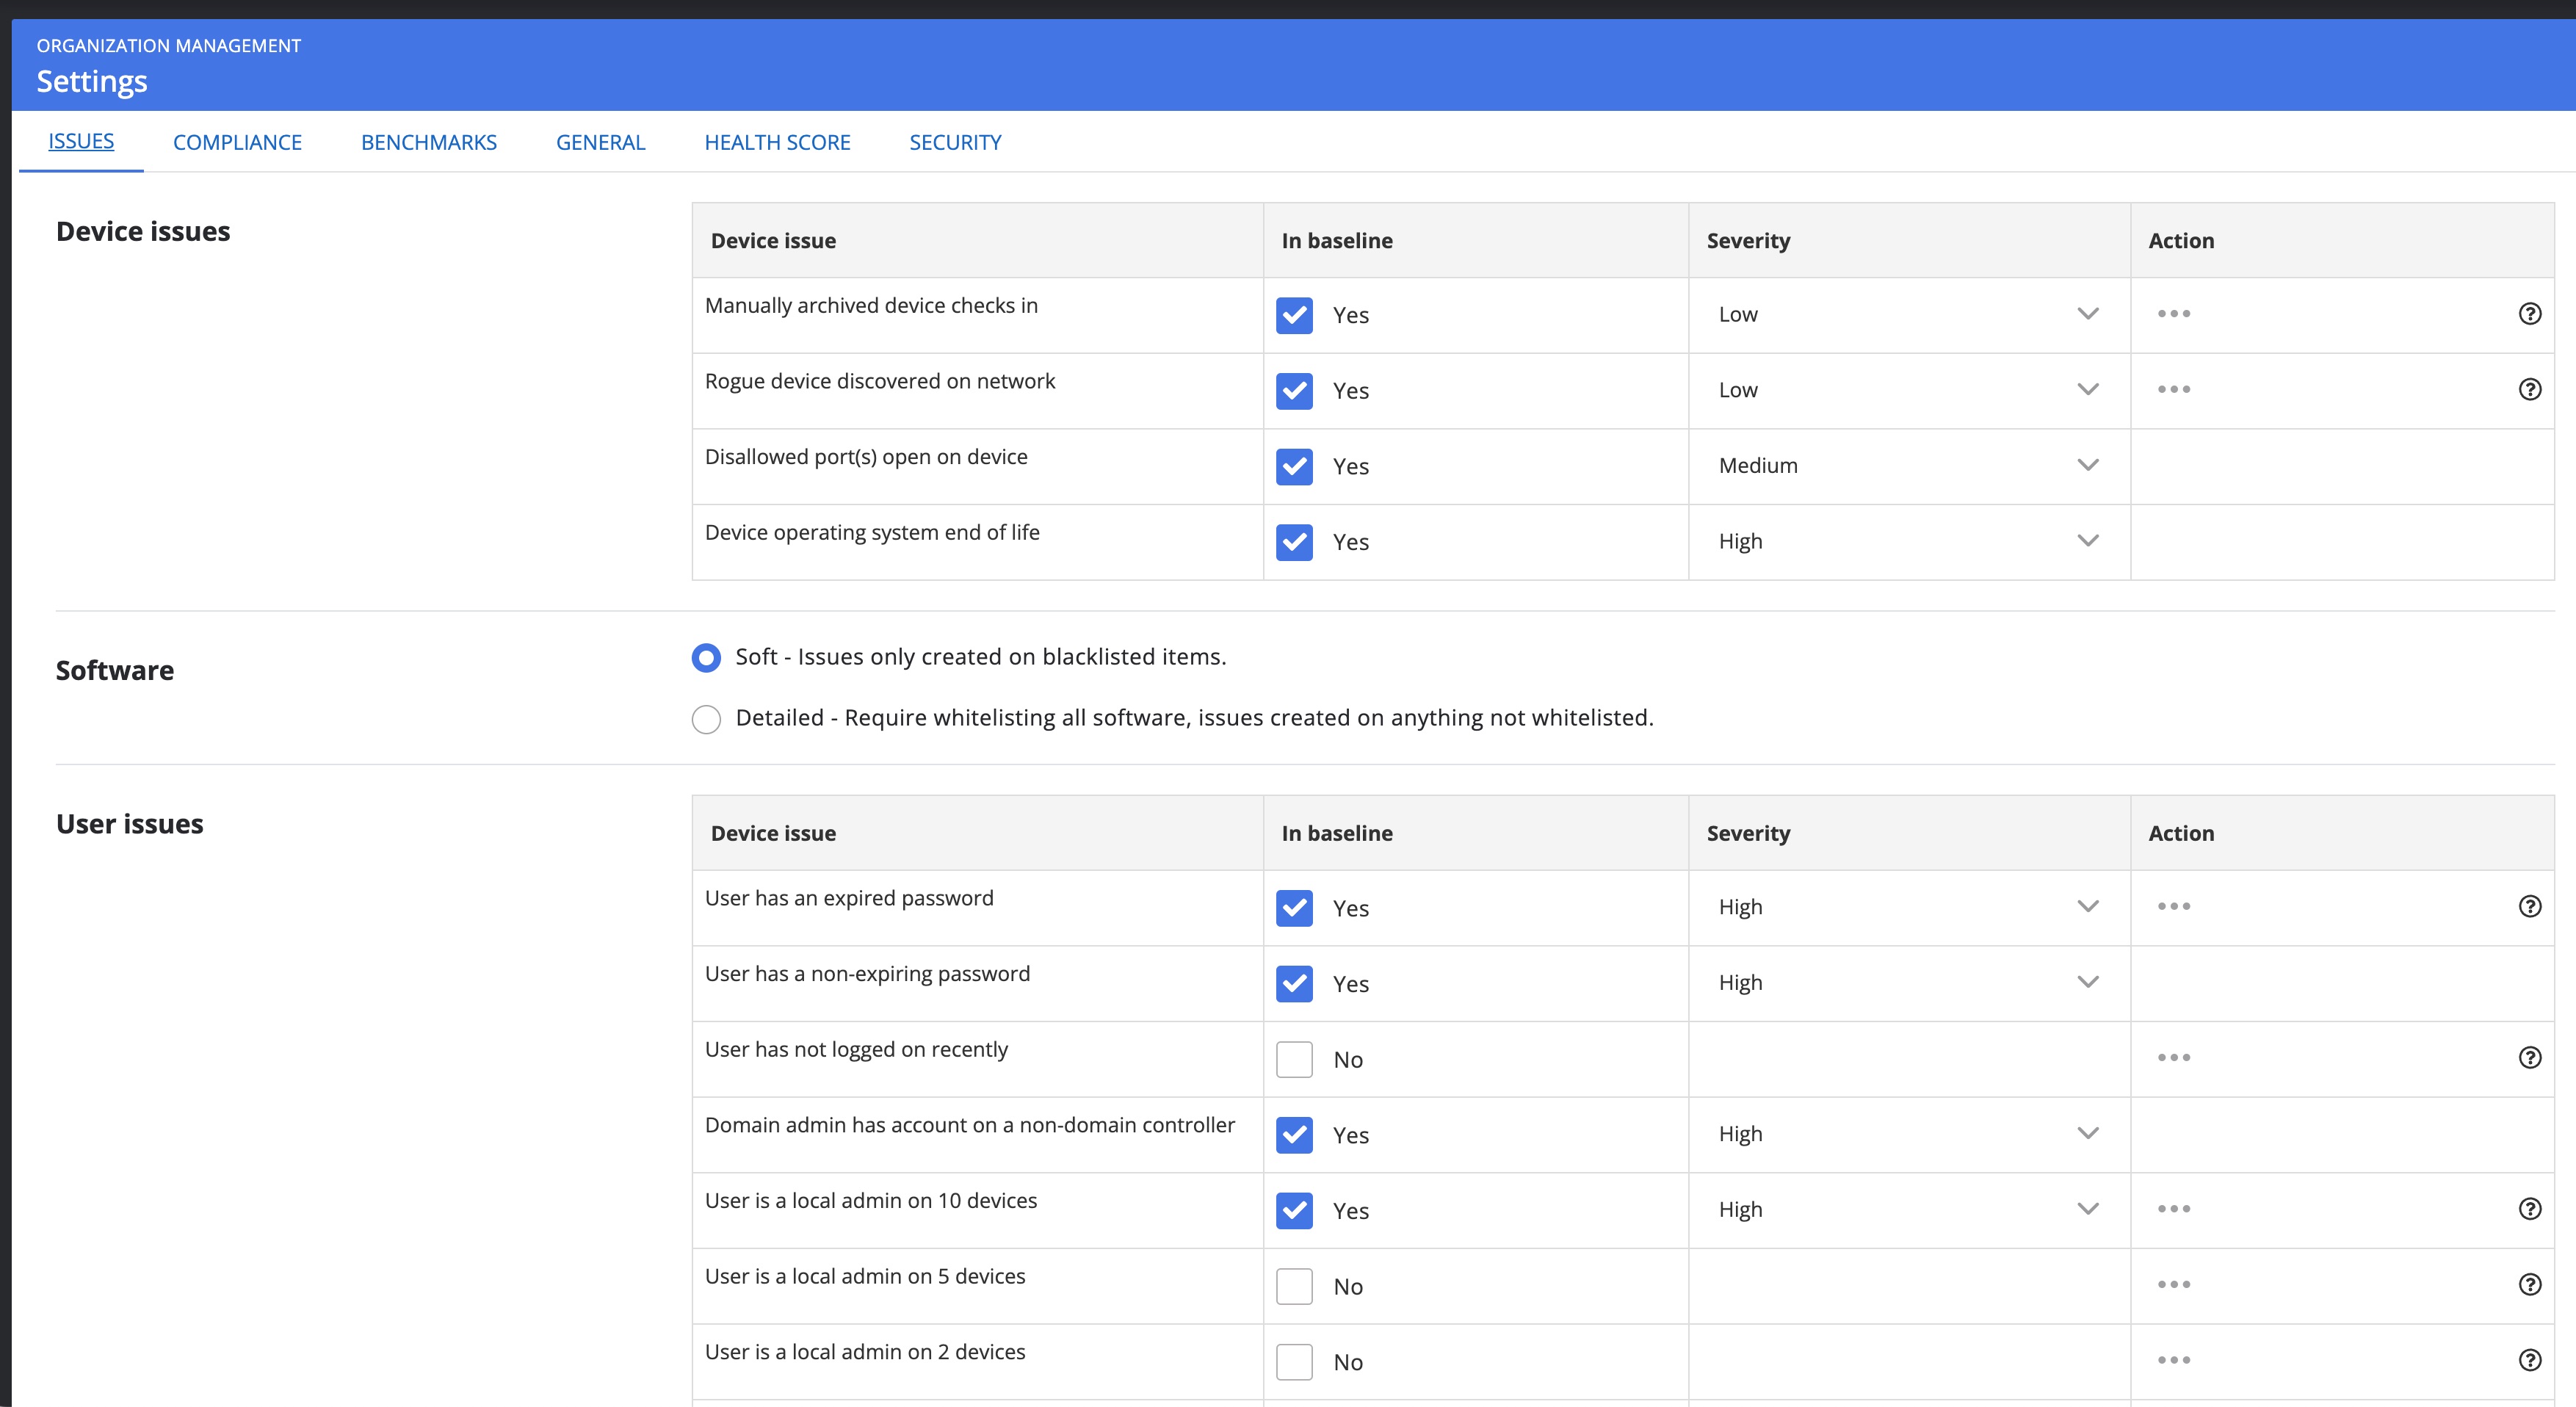
What these settings do exactly and how they affect the Nanitor discovery engine is described in detail in the administration guide. The default configuration set shipped with a fresh install of Nanitor is a good starting point but needs adjustments. Implementing additional technical requirements in Nanitor is done after having lifted the score on the asset's configuration.
Creating projects for remediation
Nanitor Projects help you to manage the remediation work that needs to be done to increase your IT security posture. The IT security posture is the core of Nanitor and that is what your efforts are measured against. Nanitor measures your lIT security health and tracks the progress towards a more resilient IT infrastructure. Progress is achieved by remediating detected issues. You can group issues that belong together or have similar remediation and should be worked on in the same context or within the same person or team. Nanitor Projects can be timeboxed which helps to define deadlines and or milestones. The progress is automatically calculated by Nanitor to identify agreed remediation projects that are gotten off the rails or (hopefully) to confirm that you are on track.
Creating a project and assigning issues to it is easy. Detailed instructions can be found in the project user guide. Projects can be of different types since you might also want to track the progress against installing clients to report to Nanitor or hardening a specific asset that needs attention.
Just have in mind to keep it small to start with to get an idea of what you can manage in a certain period. Focus in the beginning on things that have a high impact and a low risk on the IT infrastructure.
Hardening the IT environment is time-consuming. Teams and resources have usually other day-to-day tasks they need to work on at the same time along with the challenge to make assets more secure while still ensuring everything works as expected.
Looking at your IT security health
Once all (or at least the majority) of your assets have been added and are monitored actively by Nanitor. Nanitor determines the overall security score of your IT infrastructure (Organizational Security Health or OHS) based on the collected information from your assets and according to your configuration settings. A detailed guide that explains the math behind the health score calculations is in our knowledgebase article. The security score (OHS) can be accessed from the Health Status dashboard (Dashboards -> Health Status).
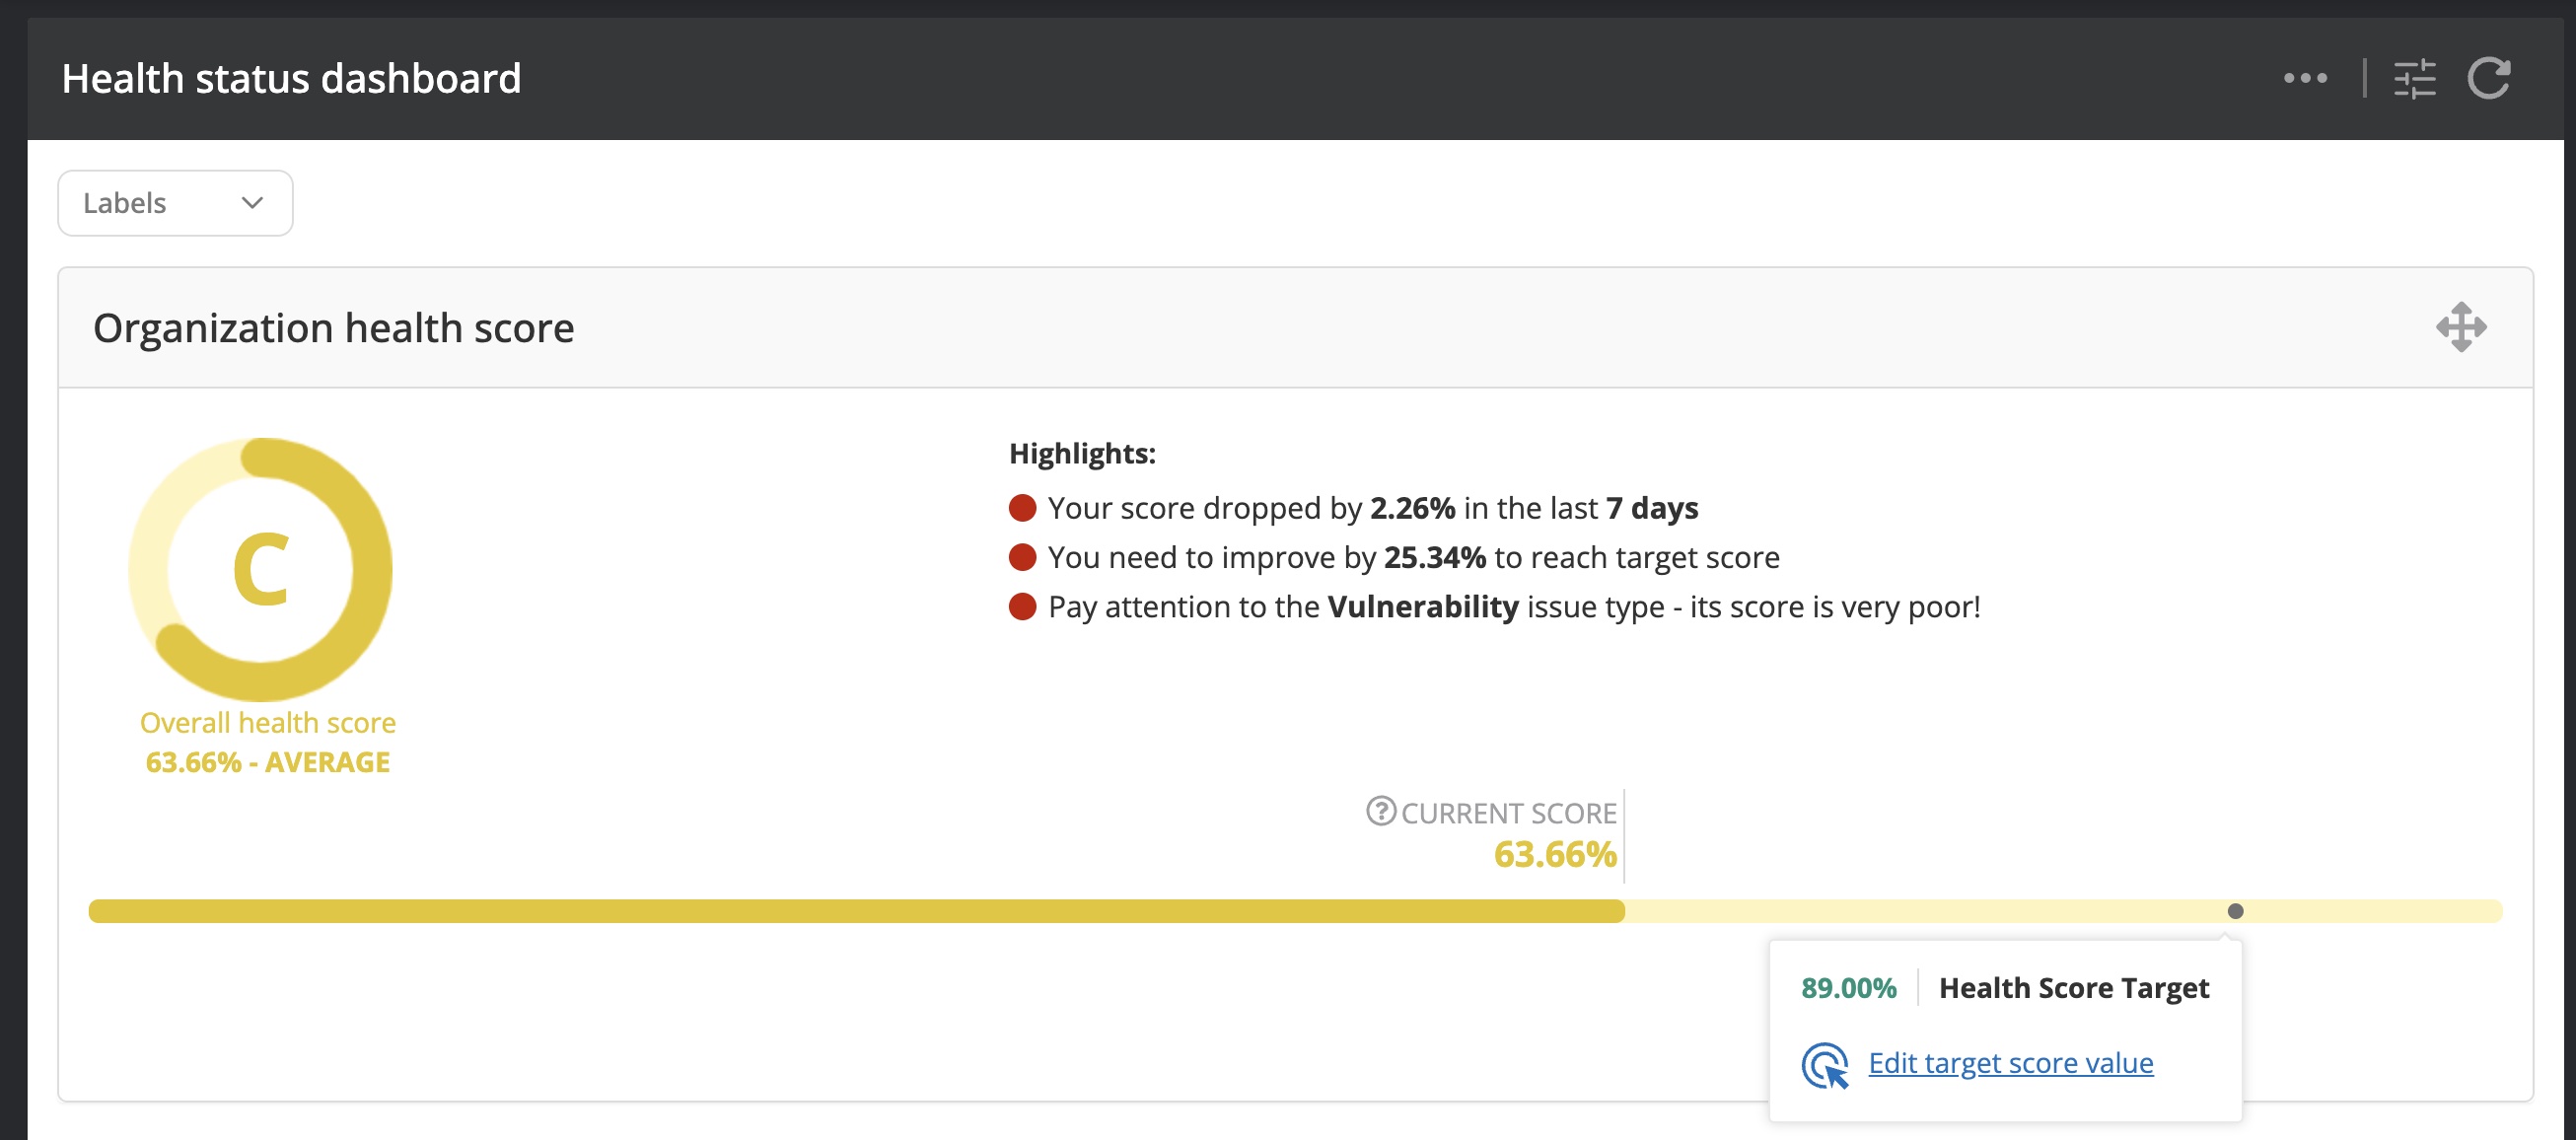
Besides the calculated health score Nanitor sets a target goal. The default target goal is 95%. The goal should be lowered to start with to match your current state and the ability for you to adjust the security settings on your assets and remediate detected vulnerabilities. The health score target can be adjusted directly from the dashboard or the configurations.
Generating reports
Reporting on progress and status is the key for almost every software. Nanitor is no exception. You need to see what you need to work on and how you should do the work. The issue prioritization within Nanitor will make sure that you work on the right things and the provided remediations make sure that you know how to resolve your issue.
Nanitor reports provide the information needed by the internal security teams but also for externals when it comes to auditing your infrastructure against compliance frameworks.
Nanitor helps you to identify the progress on improving your security posture. And if does not you know that you need to put more effort and resources into hardening your IT infrastructure.
Reports can be divided into high-level reports focussing on key metrics and more detailed reports to identify all changes that happened not only in your IT environment but also all changes made to your configuration settings and exceptions made in Nanitor.
Managers and team leads are interested in high-level reports that show the current state along with progress that has been achieved over the last couple of weeks. In this category fall dashboards and trend metrics reports.
- The Health Status dashboard (Dashboards -> Health Status) is the starting point that shows the overall health of your IT infrastructure. The health represents the resiliency of your asset fleet against potential cyberattacks. More details on how the health metrics are calculated can be found in the health article. Besides information on the organizational health score (OHS) and its progress, it breaks the health down by issue type and shows a list of key issues that have the most impact on the organizational health metrics. The metrics can be filtered by a label.
- The Progress dashboard (Dashboards -> Progress) delivers information on the progress of detected and resolved issues, issue violations and remediation projects.
- The Overview dashboard (Dashboards -> Overview) delivers all kinds of interesting key metrics that can draw your attention across various aspects that matter for cyber security. It shows key metrics on the number of monitored assets, top incompliant software titles, and the number of detected severe vulnerabilities just to name a few. Depending on your focus area at each point in your trip to increase the resilience of your IT infrastructure you might be interested in various of the available widgets. The results can be filtered based on one or more labels to narrow down the focus even further.
- Both the Security configurations (Configurations -> Security configurations) and the Configurations trends (Configurations -> Configurations trends) show key metrics on how assets are configured (hardened) according to the recommendations from the Center of Internet Security (CIS). Security configurations ensure that cyber attackers will not gain immediate access to information once they managed to find a way into your IT infrastructure.
- The Issue trend metrics report (Reports -> Issue Trend Metrics) is a detailed and comprehensive report on detected and resolved issues and monitored assets capturing activity over the last 12 months. The report has many filtering and grouping options that allow adjustments according to the user's needs. The report has a good balance between showing high-level trends and details between months.
- The Patch status report (Reports -> Patch status) is another useful report that gives a quick overview of outstanding patches. Nanitor considers patches to be installed within 30 days and the report will group outstanding patches into overdue and non-overdue pending patches.
More details on various available reports throughout Nanitor can be found here