Patch Status Report
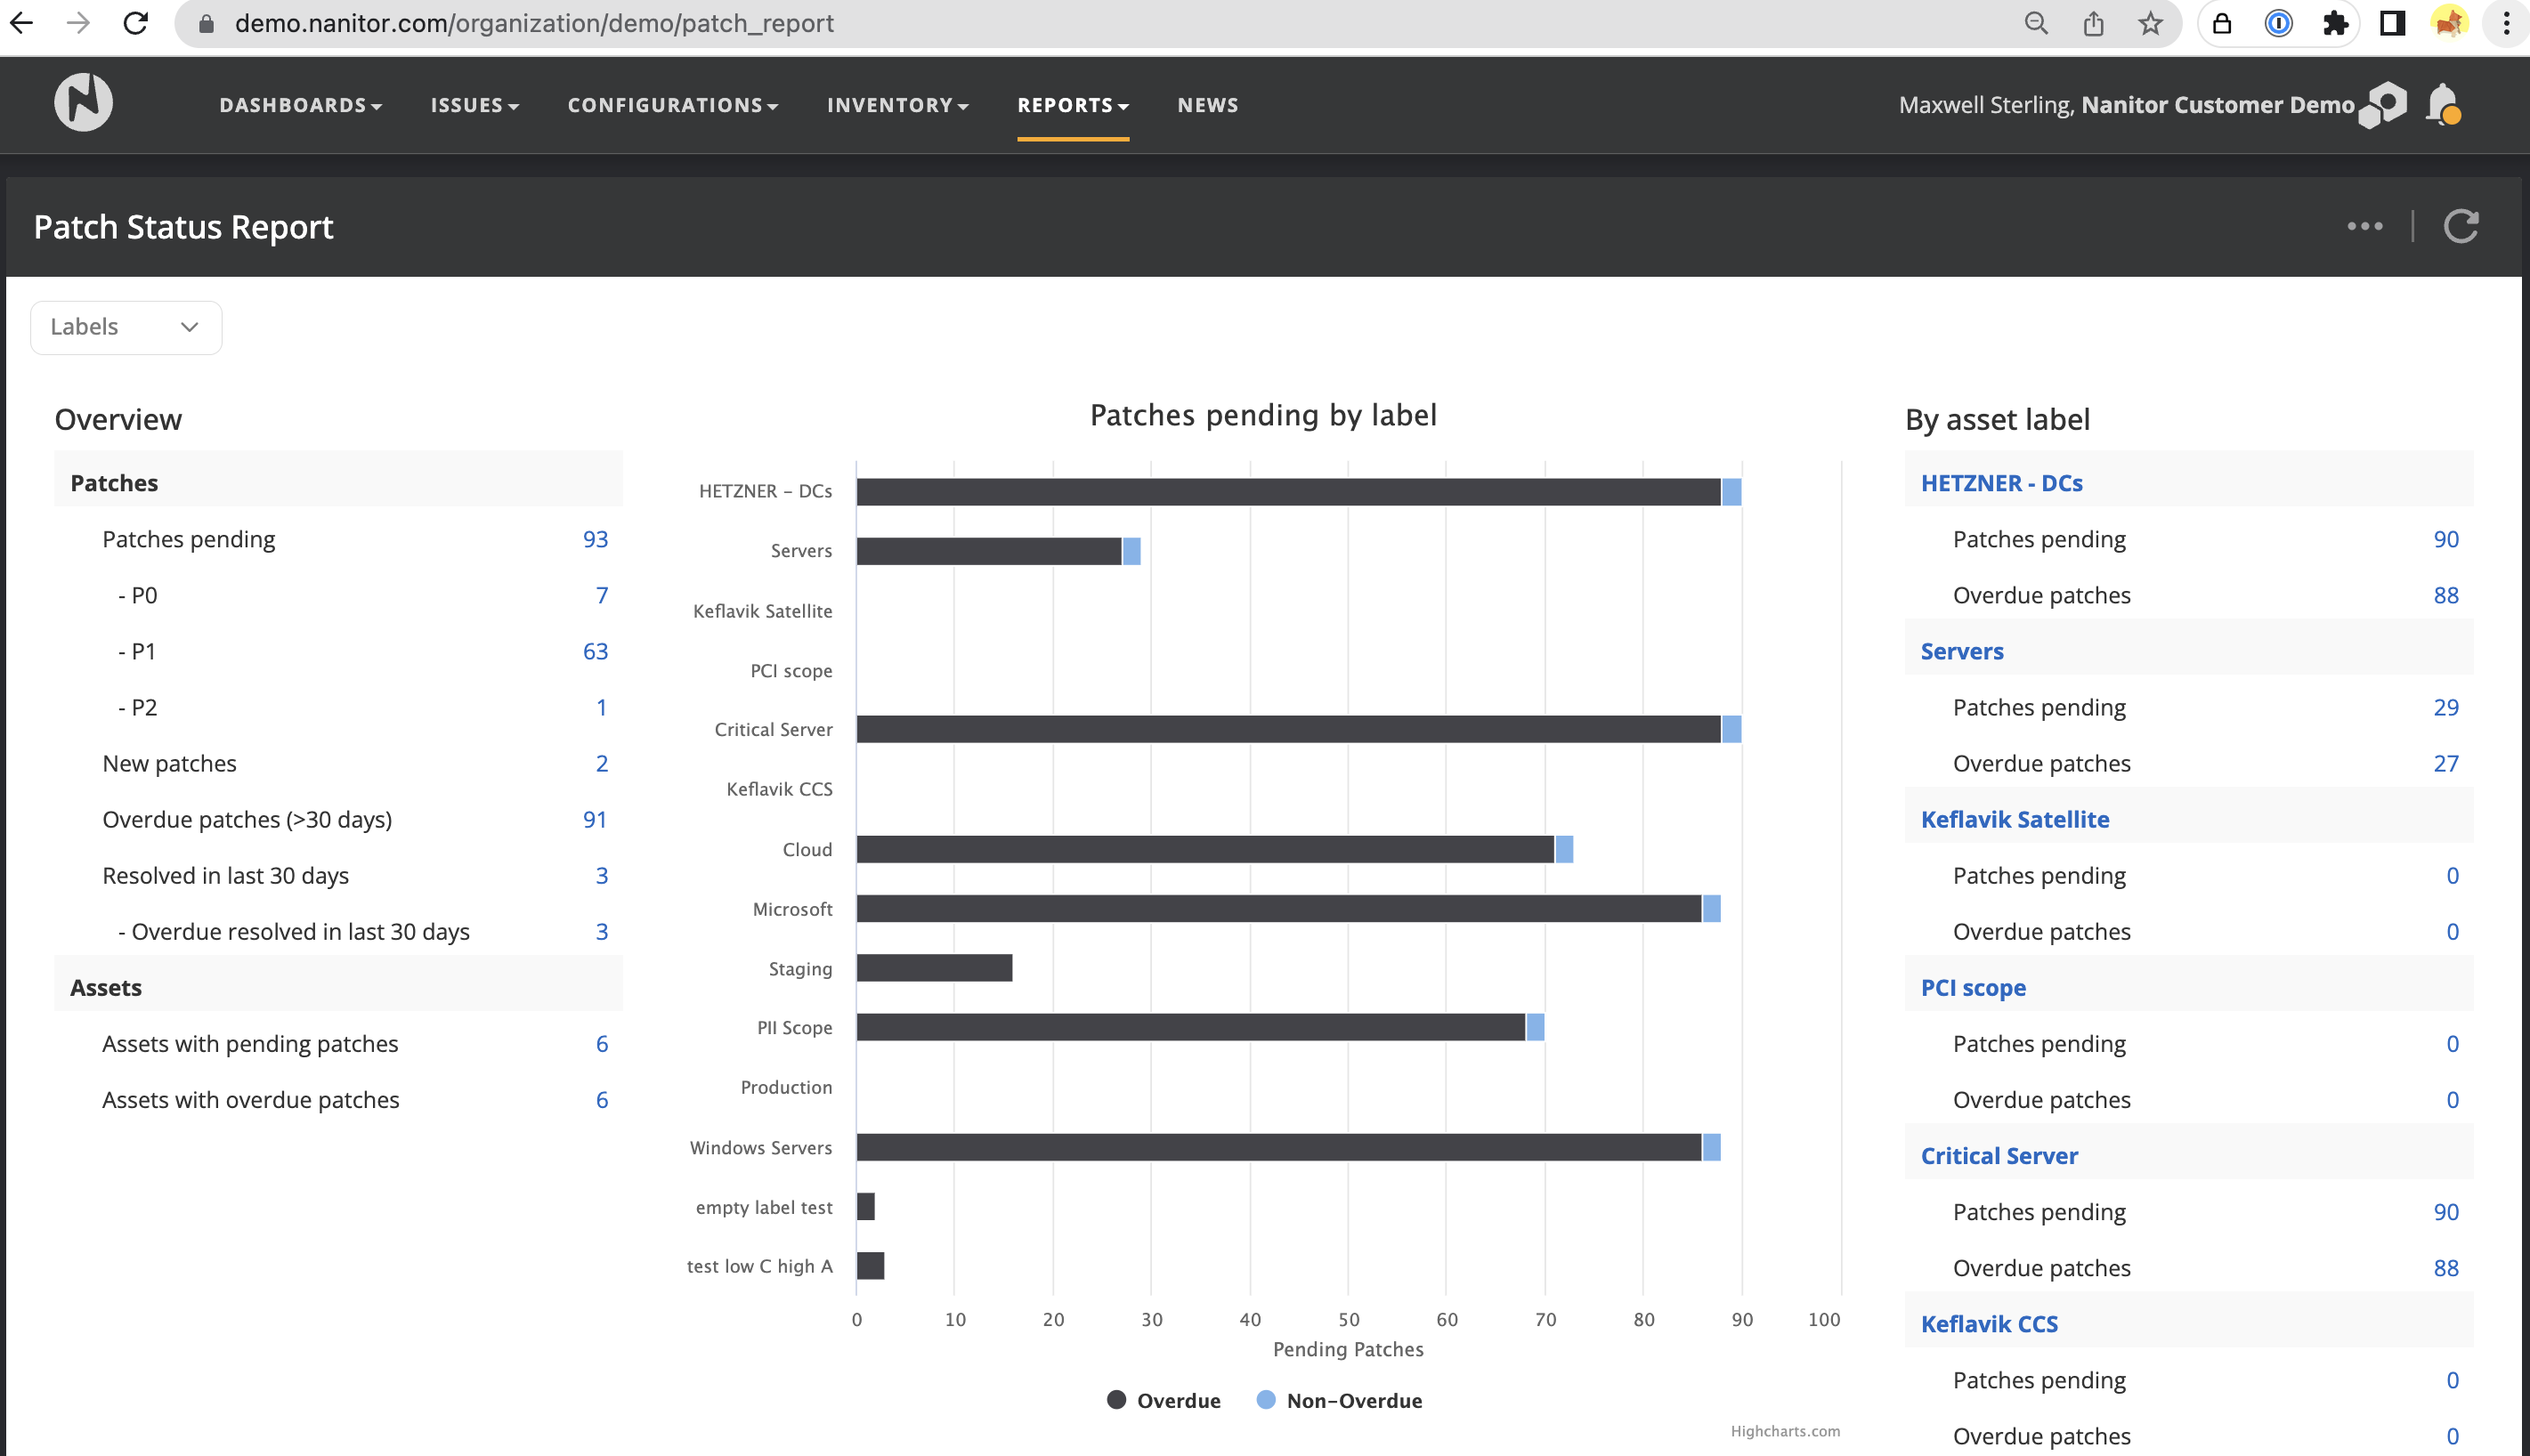
The Patch Status Report in Nanitor is a valuable tool for organizations to track their patch management progress. The report provides an overview of the number of security patches missing, broken down by P0, P1, and P2 priority groups. It also shows new patches (detected as missing within the last 30 days) and overdue patches (missing for more than 30 days).
The report is useful for complying with PCI-DSS requirement 6.2 by giving a high-level summary of the patch status across the organization. It also allows management teams to compare their patch status by asset label, providing a gamification aspect to motivate improvements.
The report is grouped by existing asset labels, and the total number of missing patches is listed in the overview section, along with information about overdue patches. The report also provides information on which assets the patches are missing from. Clicking on the links provided in the report leads to a list of issues/assets with an applied filter.
The Patch Status report can be filtered by asset label, but for detailed information about individual assets, users should visit the asset detail. The report provides information on the number of patches pending, including new, overdue, and resolved patches in the last 30 days.
Finally, the report can be exported in a format suitable for sharing with other stakeholders, with a PDF export option available.
The report is divided into three main sections:
- Overview: Shows patches pending in terms of priority groups, new, resolved, and overdue patches. Secondly, it shows the number of assets with pending and overdue patch statuses.
- Patches pending by label: Shows the patch status by asset label. This can be used to compare teams, and services, in both terms of pending patches, and overdue patches (> 30-day old patches).
- By asset label: Tabular form of the report showing patches pending and overdue by label.
Filters:
- Label: The report can be filtered by asset label. When applied the report is calculated from only the subset of devices having the specified label. Note: If assets have more than 1 label, multiple labels can still appear in the filtered report.
Actions
- Export: The report can be exported as PDF.