Overview dashboard
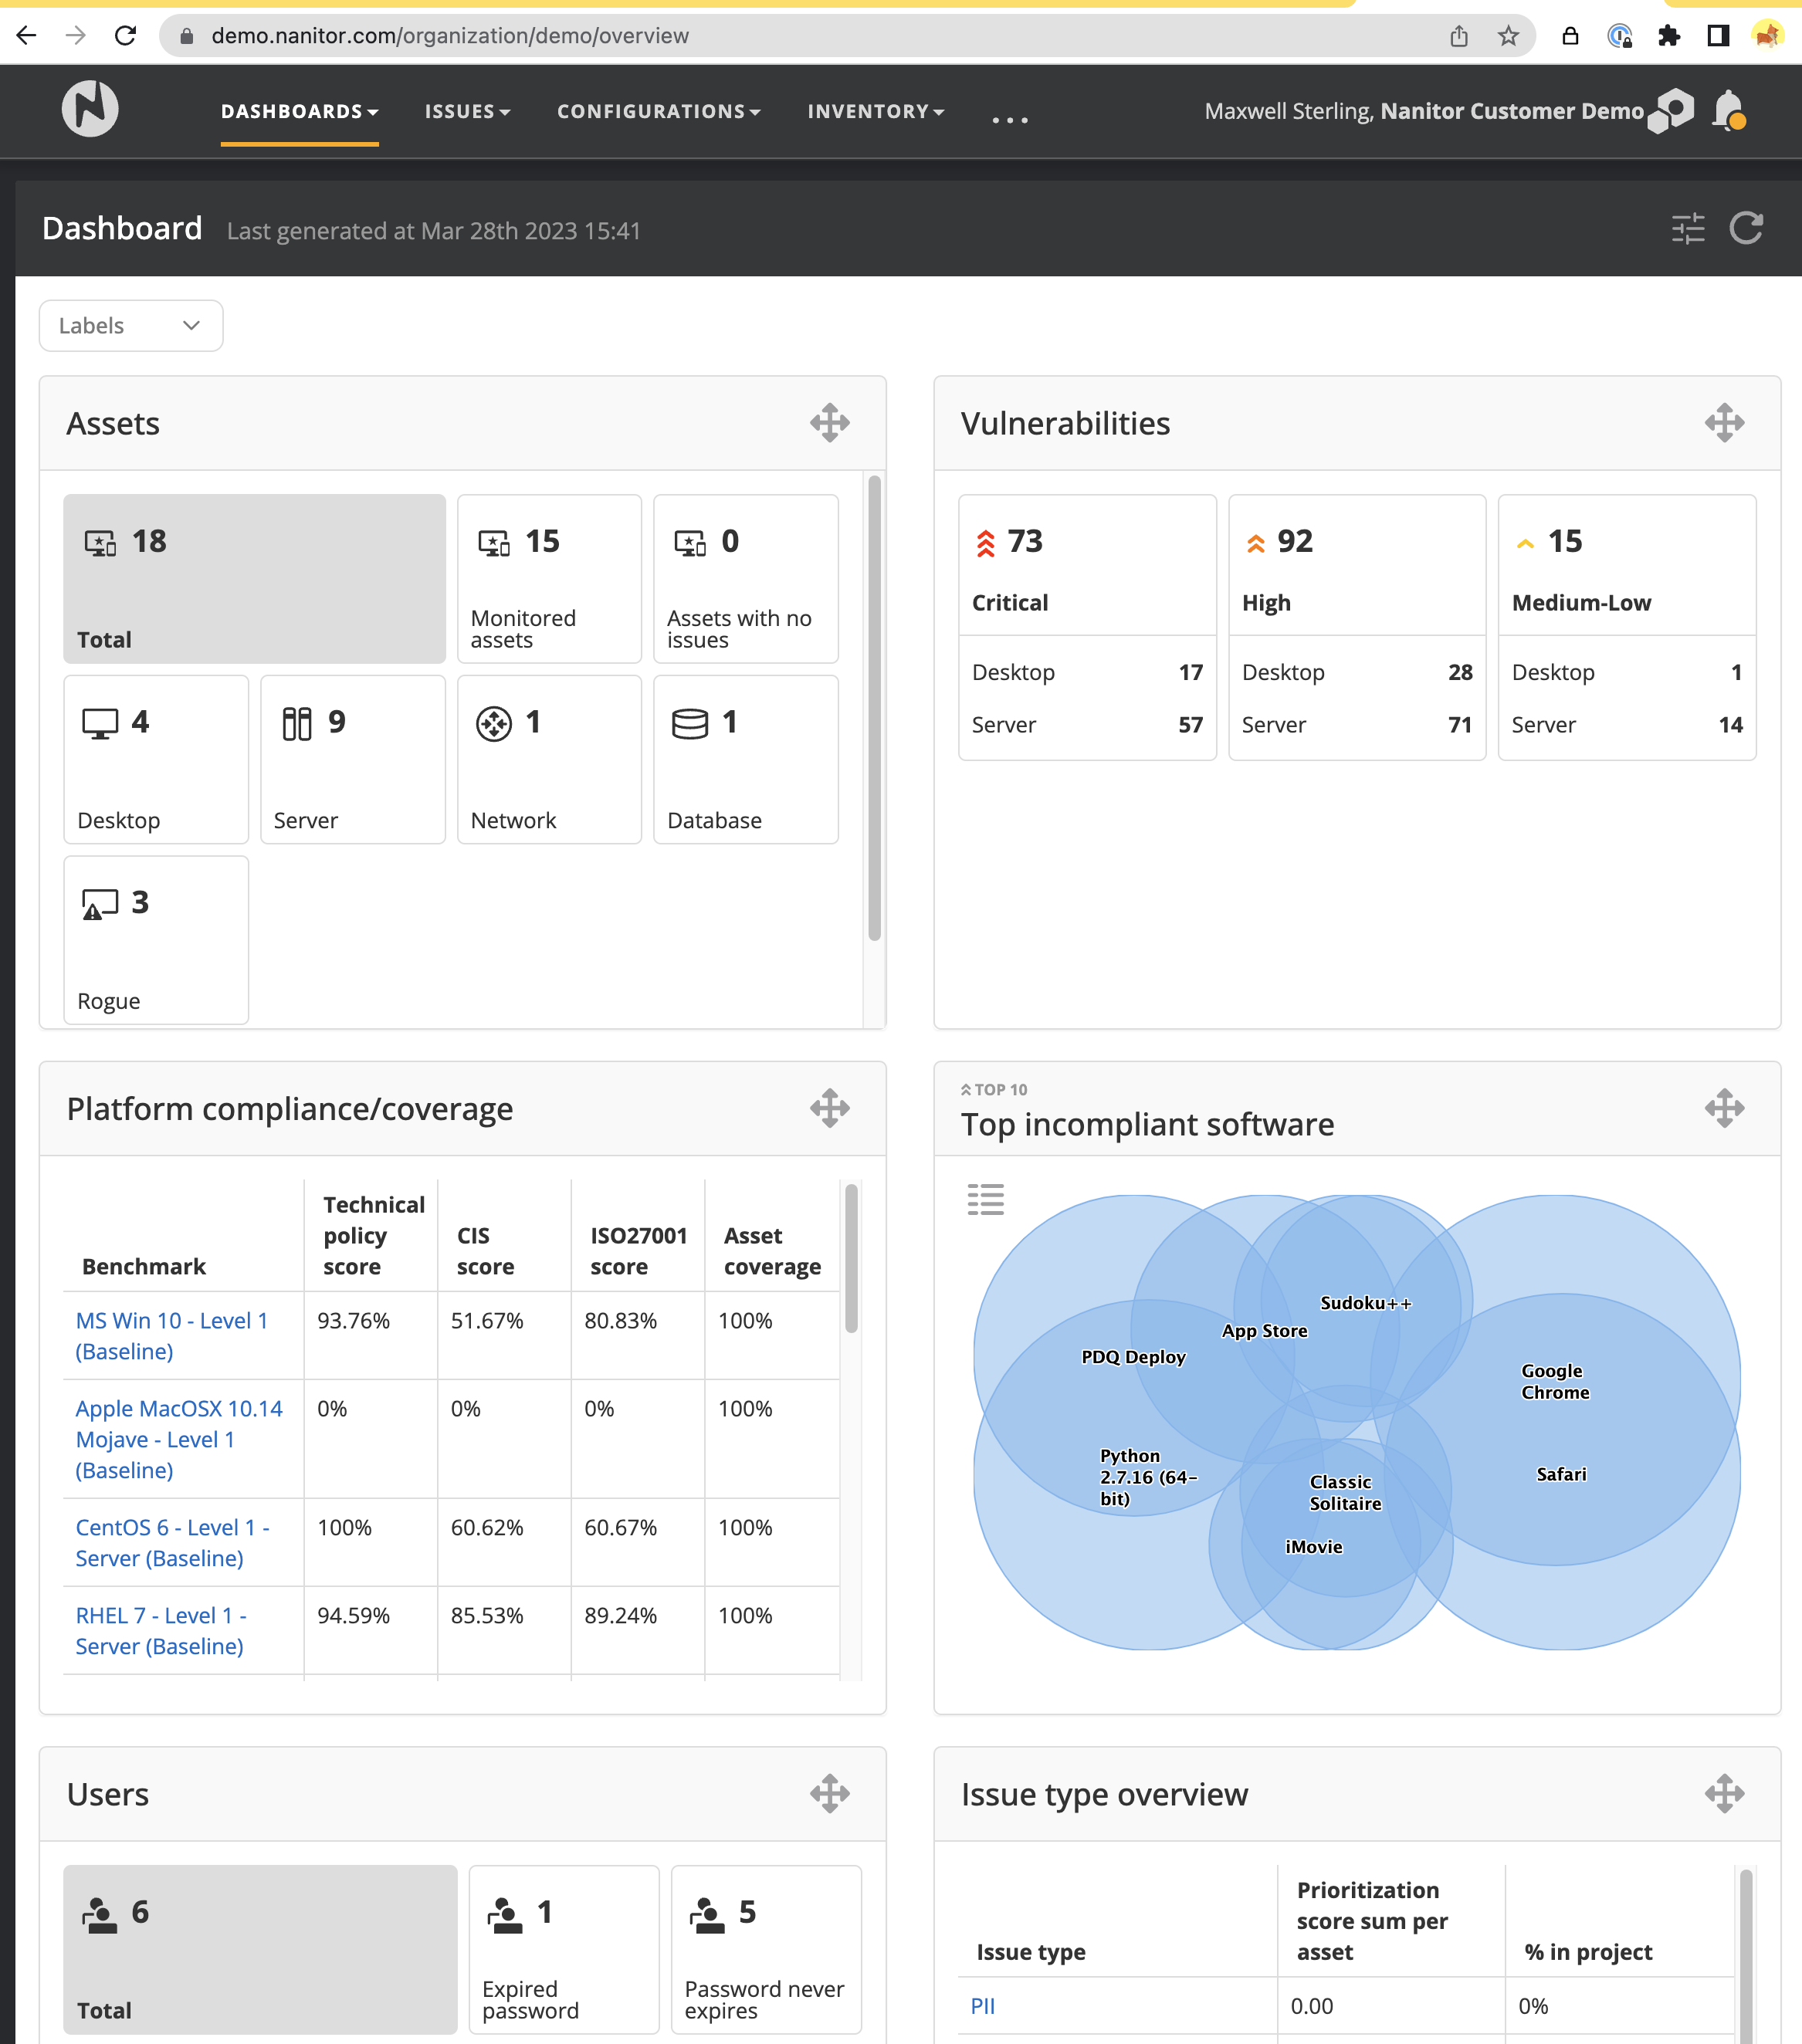
The Overview dashboard provides a high-level view of the security posture of your IT infrastructure. It includes key metrics such as the number of vulnerabilities found, the number of vulnerabilities remediated, and the overall vulnerability score. This dashboard also provides a summary of the top vulnerabilities found, along with their severity and remediation status.
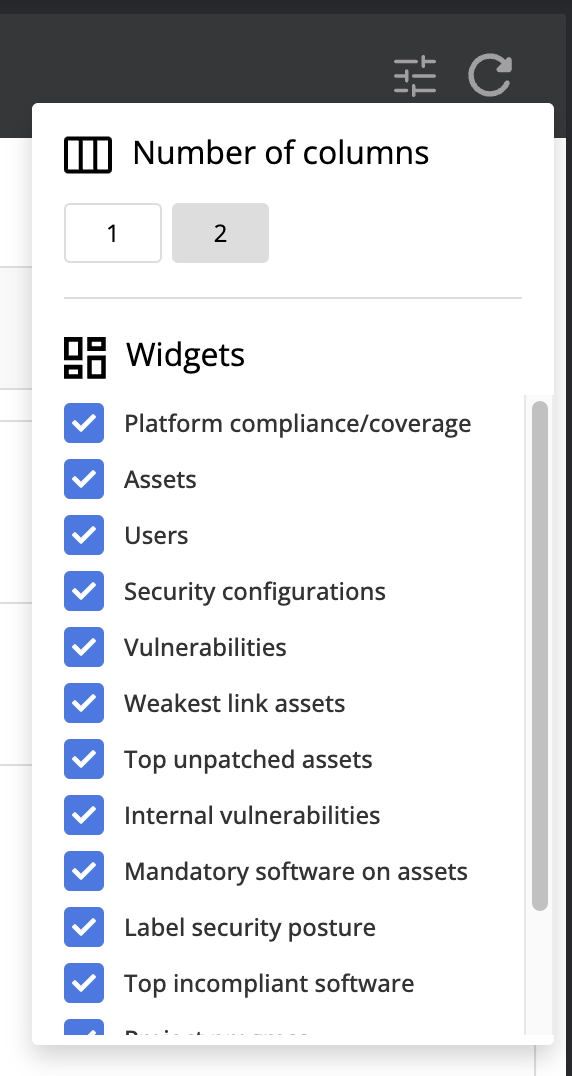
The Overview dashboard provides a set of widgets. Each widget is a box that can contain a visual element such as a graph, or a table. In some cases, there is an option to change the information, such as toggling between a list or a graph representation. The main difference between Dashboards and Reports in Nanitor is that the user can rearrange the widgets as desired. And the user can also decide what widgets to include in the dashboards.
Available widgets in the Overview dashboard:
- Platform compliance/coverage
- Assets
- Users
- Security configurations
- Vulnerabilities by CVSS3 severity
- Weakest link assets
- Top unpatched assets
- Internal vulnerabilities
- Mandatory software on assets
- Label security posture
- Top incompliant software
- Project progress
- Issue type overview
- Issue trends
Filters:
- Asset label: By default, the dashboard is showing information for the entire organization. If provided the dashboard can be shown for only a specified asset label. This can be useful for teams to view only the status of assets under their management.
View customizations:
- Number of columns
- Widgets
Platform compliance/coverage widget
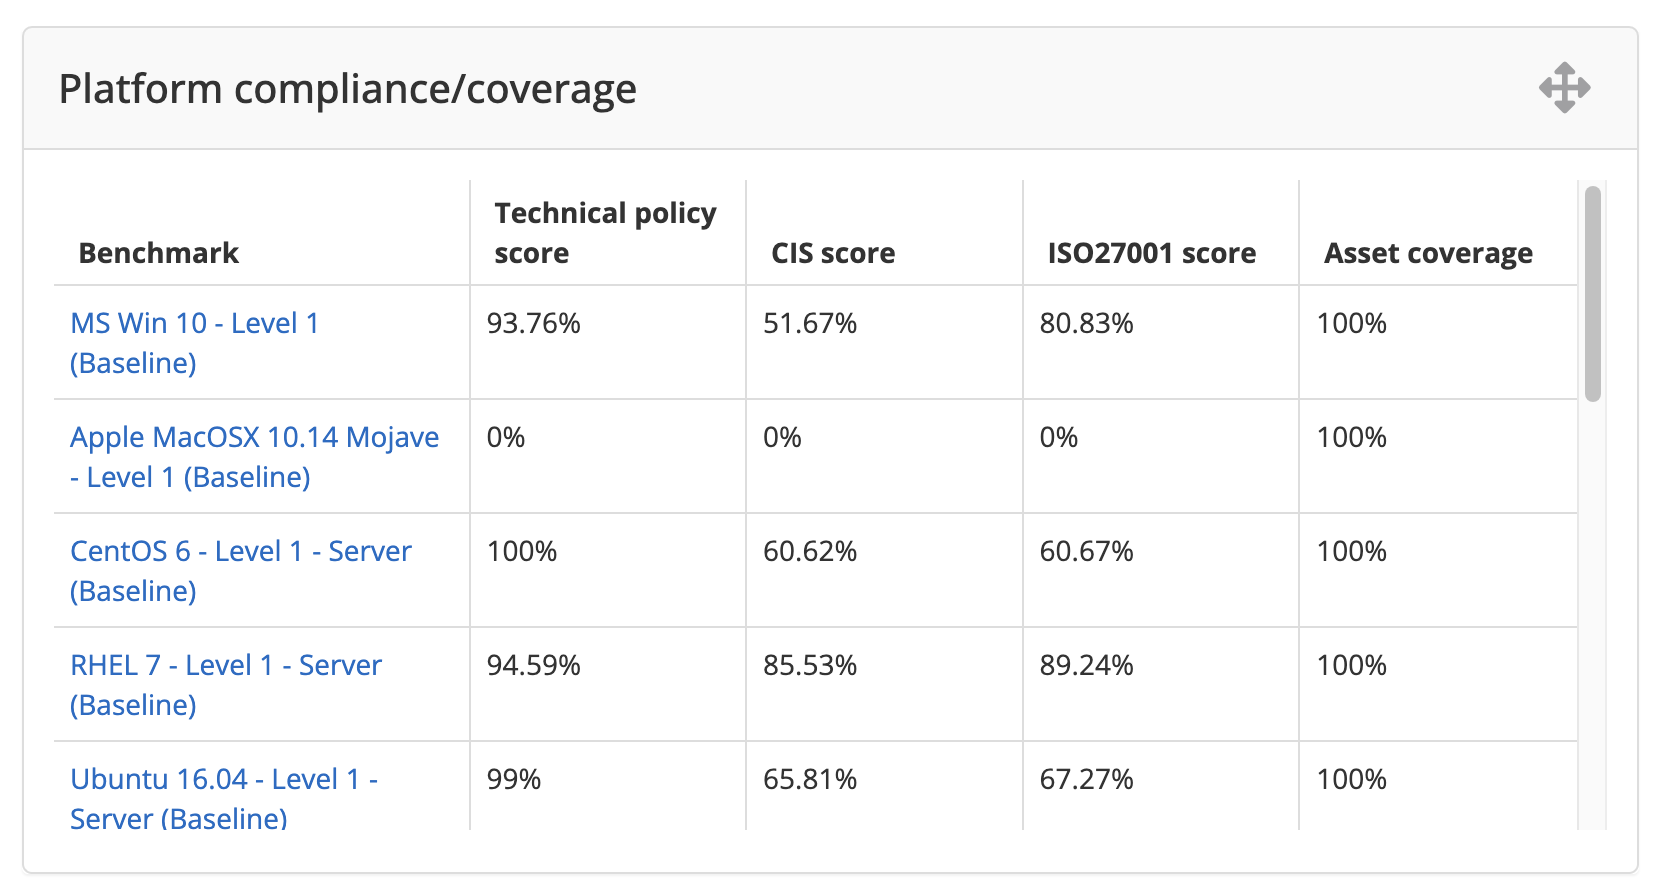
The platform compliance/coverage widget is designed to show a snapshot the status of your information systems with respect to your Technical policy (baseline), CIS benchmarks, compliance frameworks. In addition, it shows the asset coverage per benchmark.
The table shows:
- Benchmark (typically we expect to have a benchmark for each technology like OS and major applications)
- Technical policy score (a.k.a. baseline score)
- CIS score
- Compliance framework score (e.g. ISO27001, PCI-DSS, etc. depending on selection of primary compliance framework)
- Asset coverage: Number of assets that are benchmarked out of assets known to be applicable for this benchmark. (This applies only for Unmonitored devices).
Assets widget
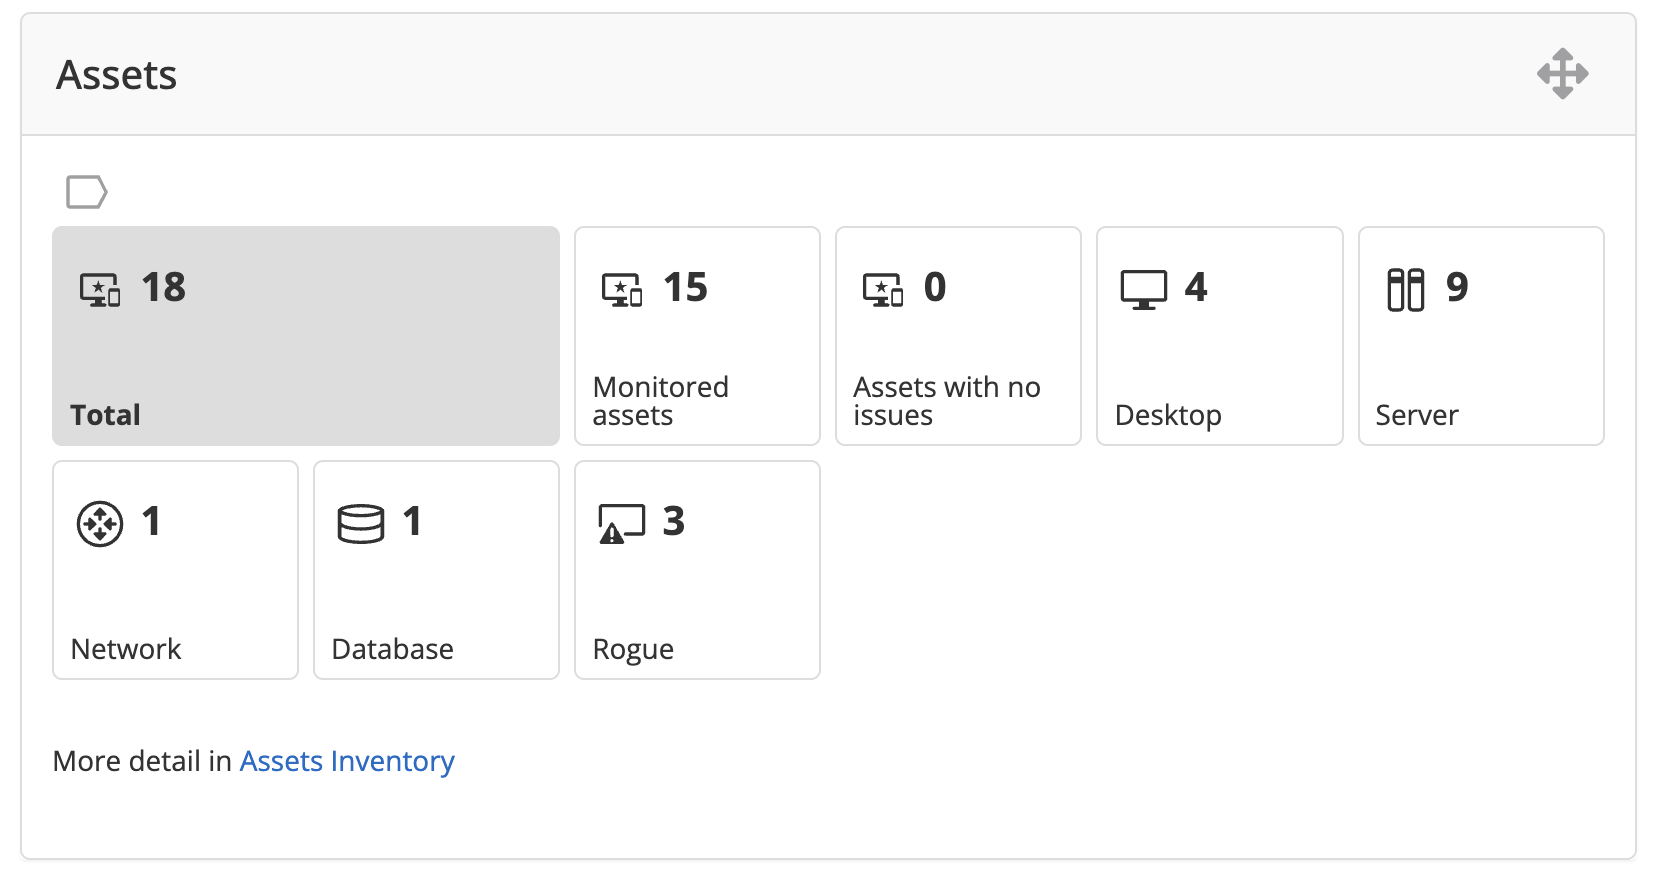
The assets widget is designed to give a snapshot of the total number of assets in Nanitor, further breaking it down by:
- Total
- Monitored assets
- Assets with no issues
- Asset type (e.g. Desktop, Server, Network, Database, Rogue, etc.)
This is useful to immediately get a high level overview of the assets onboarded in Nanitor.
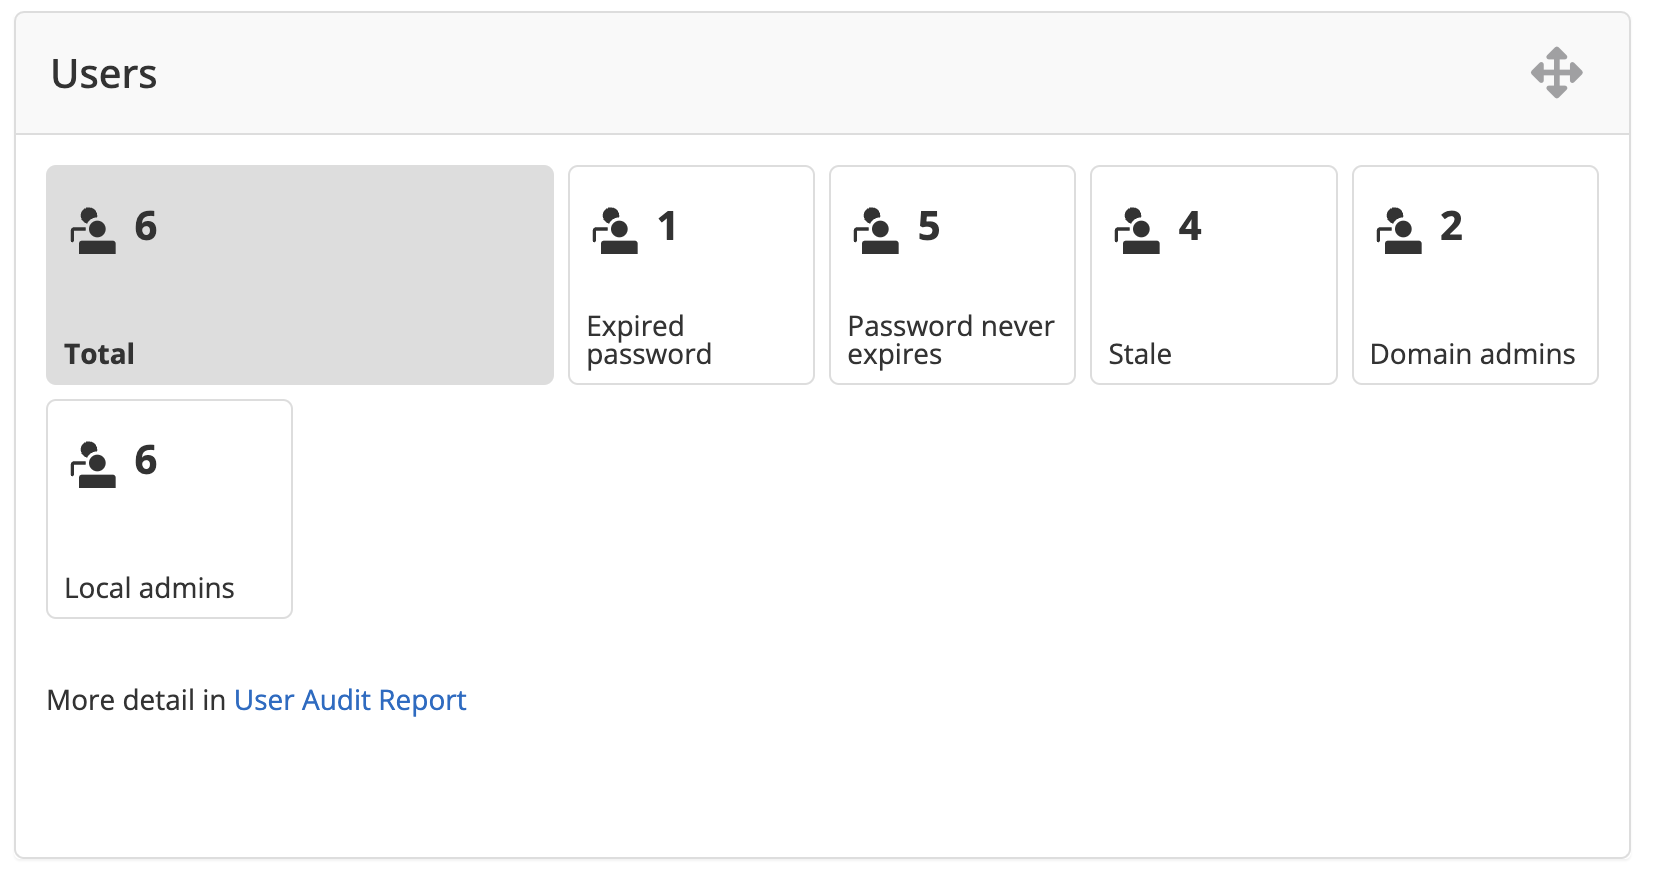
Users widget
The users widget reports on the number of user accounts Nanitor has encountered on monitored assets, further breaking it down by showing counts for:
- Total: The total number of user accounts on assets.
- Expired password: Users that have an expired password.
- Password never expires: Users that have a password that never expires.
- Stale: Users that have not logged in for over 90 days.
NOTE: It is worth clarifying that this refers to user accounts that Nanitor encounters on assets (like local and domain user accounts on Windows, local user accounts on Linux), and NOT referring to Nanitor user accounts, i.e. users that have access to the Nanitor instance.
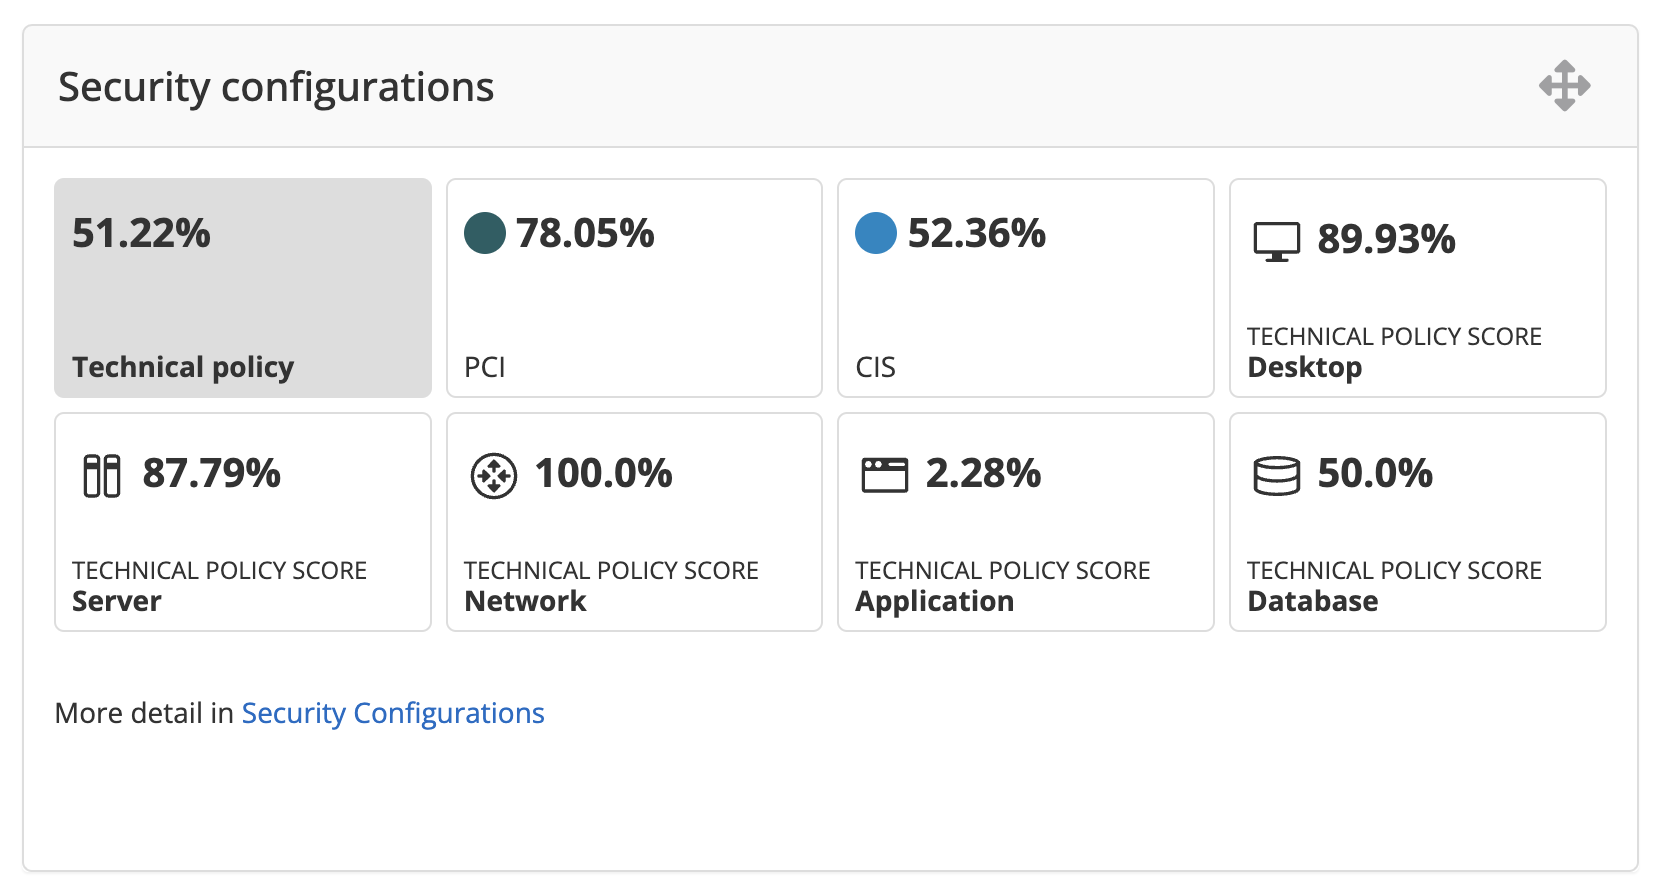
Security configurations widget
The security configurations widget summarizes the state of the security configurations in the organization. Showing the overall , showing the:
- Technical policy (a.k.a. baseline) score percentage for the organization overall. This is the fraction of checks passing divided by the total number of checks for rules that are included in the baseline.
- CIS score percentage. The overall score percentage for the organization overall in terms of all CIS benchmark rules. This is the fraction of checks passing divided by the total number of checks for rules that are marked as being a CIS rule.
- Compliance framework score percentage. This is the weighted score for the primary compliance framework (e.g. PCI-DSS, ISO27001, etc.). Note that the weighted score is calculated by accounting for rule severity.
- Technical policy (baseline) score percentage broken down by device types.
The main use case for this widget is to quickly get an idea of the security configuration state, and then can go into Security Configurations page to get more detailed information.
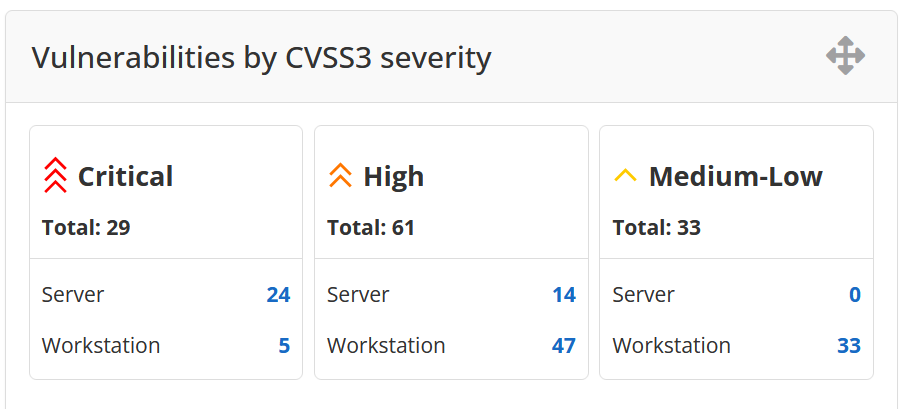
Vulnerabilities by CVSS3 severity widget
The widget is designed to give a high-level overview of vulnerabilities in the organization. It shows the total counts of Critical, High and Medium-Low vulnerabilities and further breaks it down by device type.
The Critical, High, Medium, and Low classifications are defined based on the CVSS3 scores of the vulnerabilities, where
- Critical: CVSS score 9.0 to 10.0
- High: CVSS score 7.0 to 8.9
- Medium: CVSS score 4.0 to 6.9
- Low: CVSS score 0.1 to 3.9
The issue count can be clicked to get a detailed list of the vulnerability issues for further exploration.
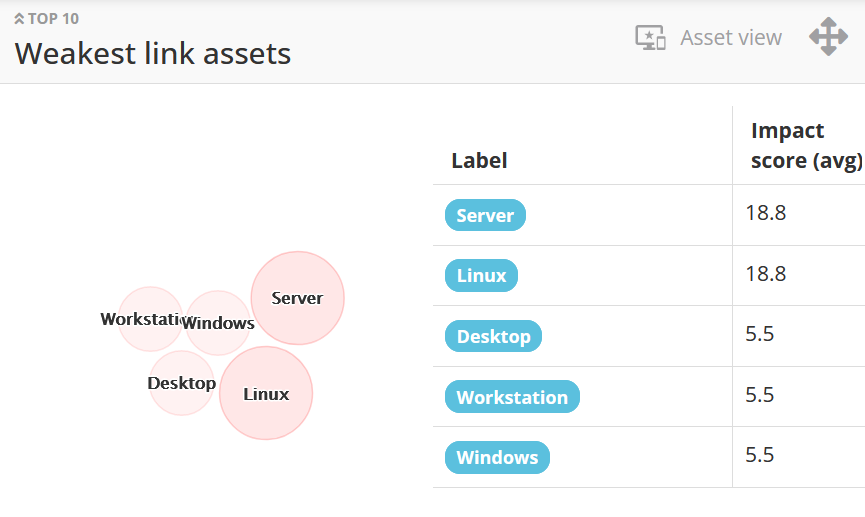
Weakest link assets widget
The widget has two views:
-
Asset view: This view shows the top 10 assets having the highest impact score. The impact score represents the potential impact of hardening this asset, based on the asset's health score and asset priority.
-
Label view: This view shows the top 10 labels having the highest average impact score for their assets.
Information is displayed as a chart and as a grid.
To switch the view, click the view switcher in the top right of the widget header.
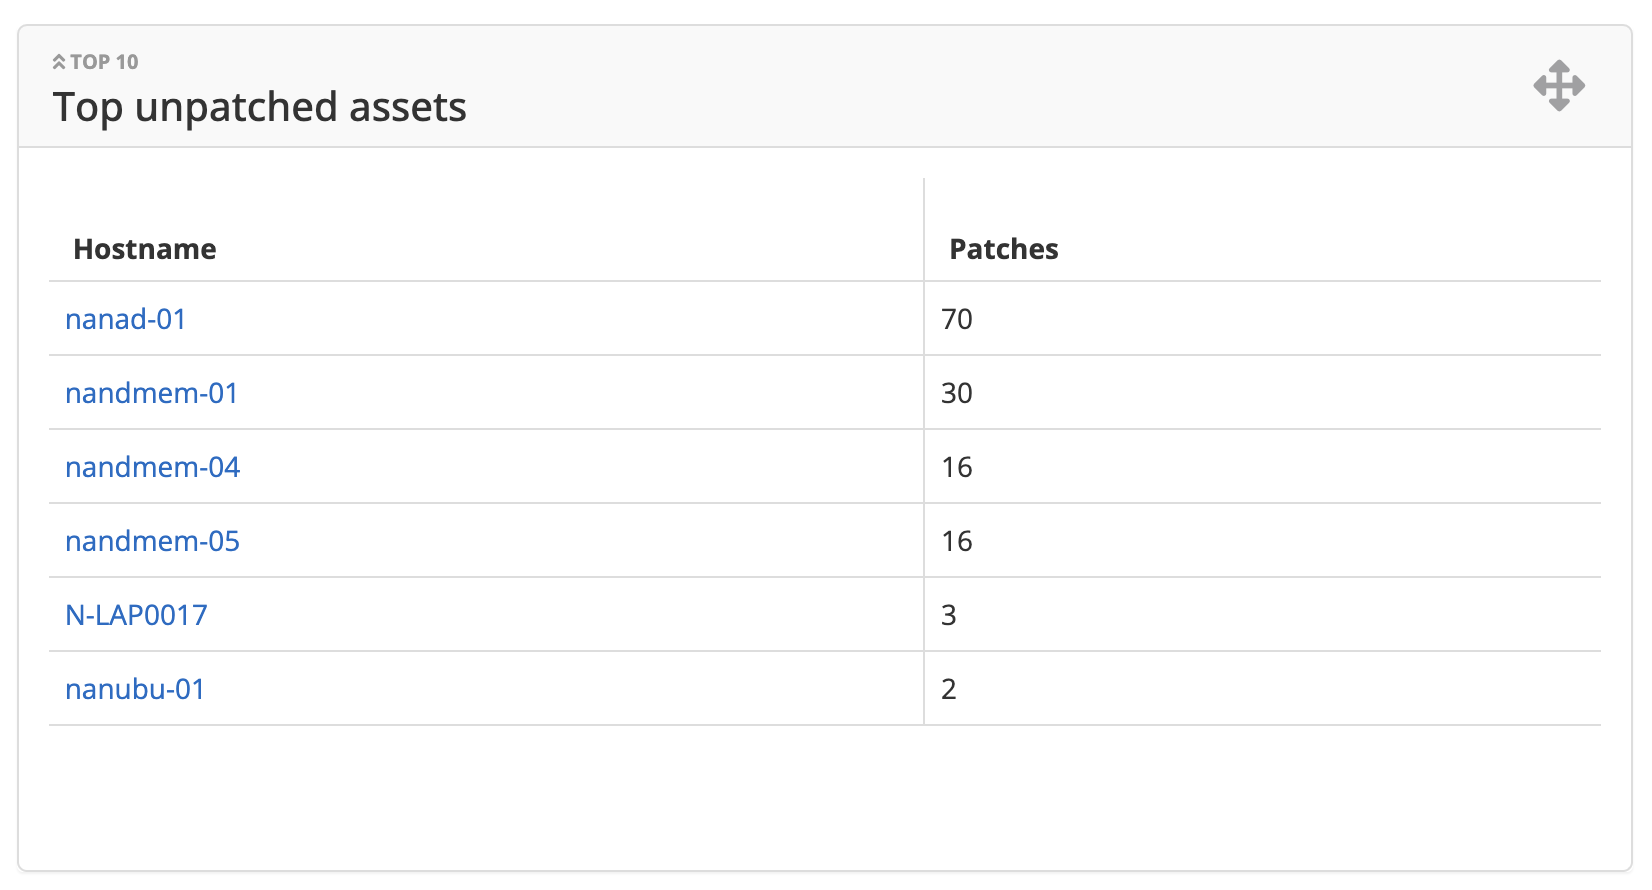
Top unpatched assets widget
The top unpatched assets widget is designed to simply give a quick insight into the top 10 assets with the highest number security patches missing. For more detail, it is recommended to look at the Patch Status report.
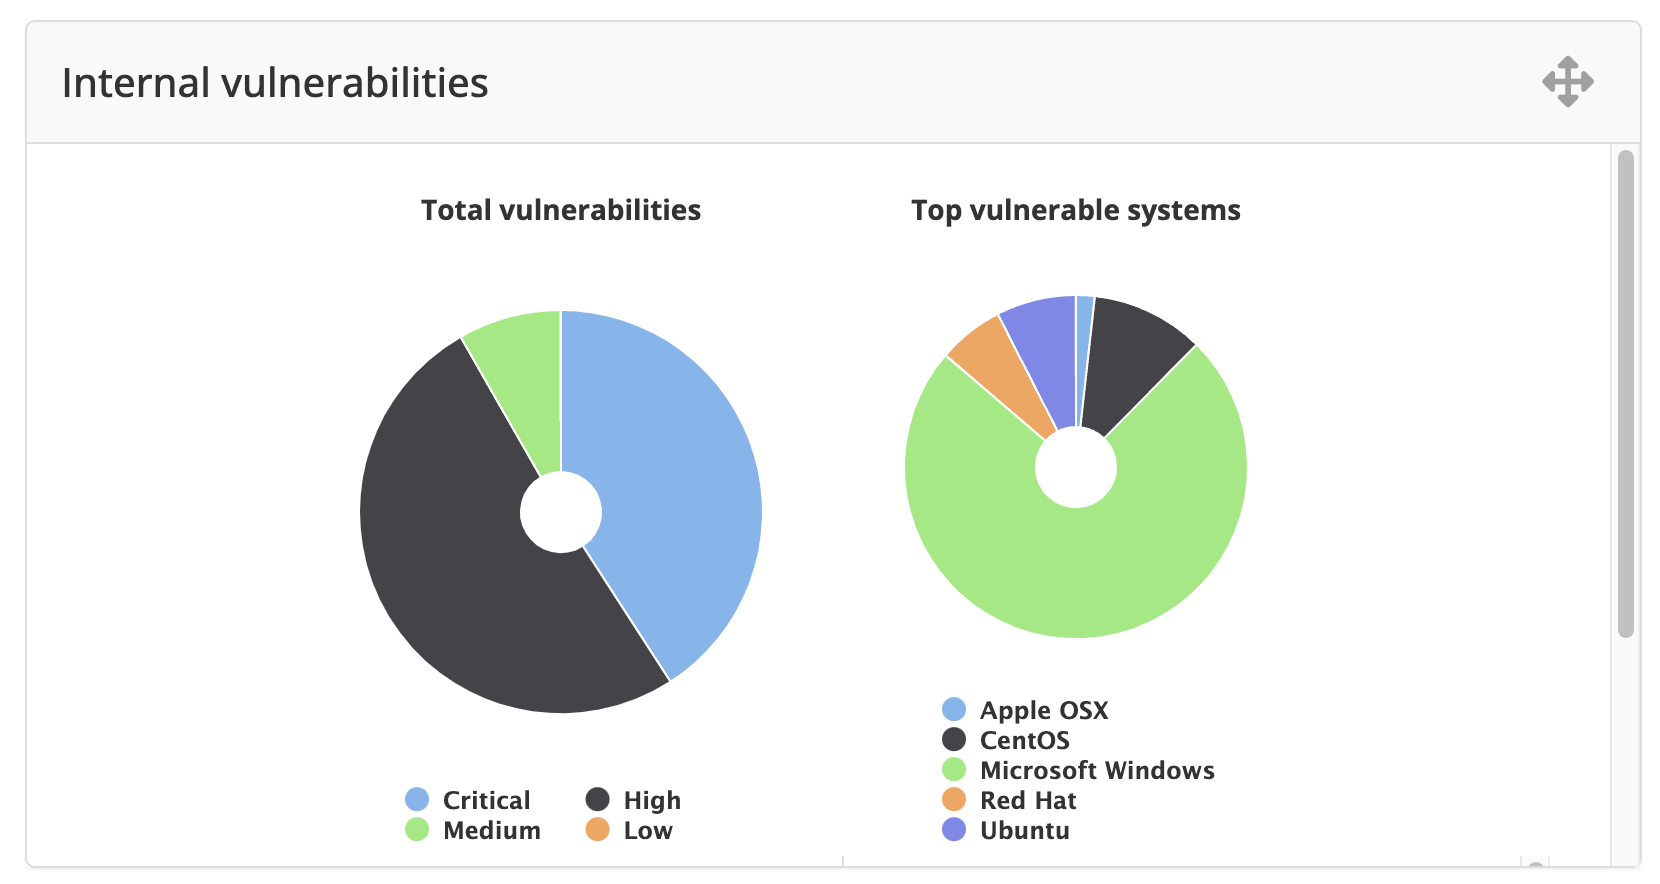
Internal vulnerabilities widget
The internal vulnerabilities widget is designed to give a visual overview of the vulnerability distribution by severity (CVSS3 severity) and system (operating system). By hovering over each piece of the donut chart, one can see the exact percentage for the distribution.
The main use case for this widget is to present the distribution of the vulnerabilities in a more visual way than the Vulnerabilities widget provides.
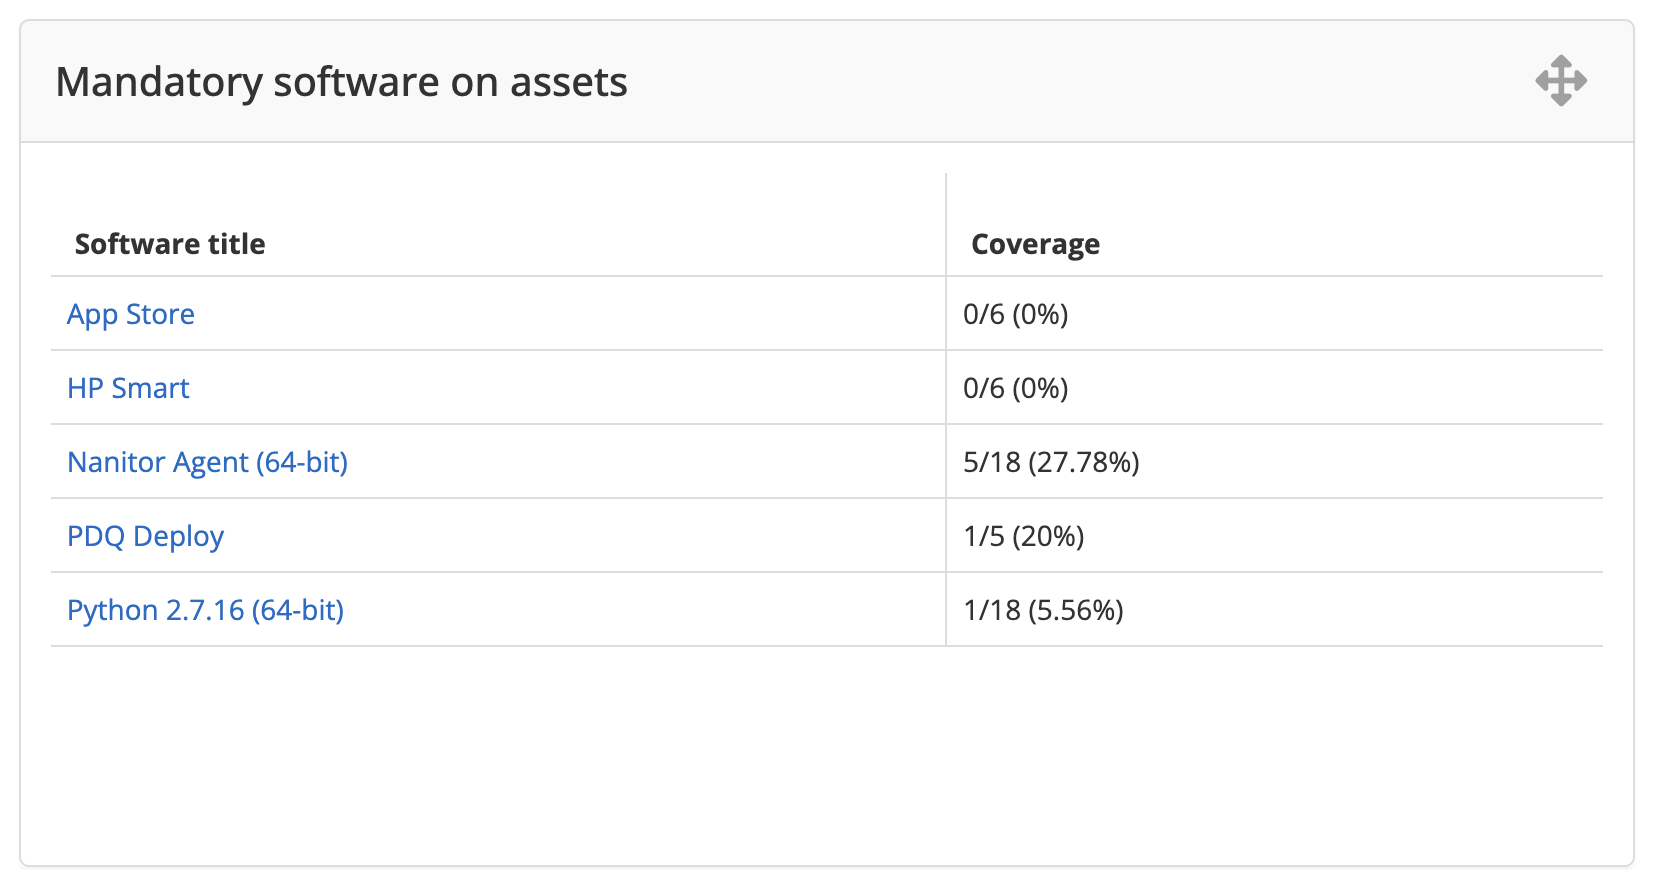
Mandatory software on assets widget
The mandatory software on assets widget is specifically designed for giving an overview of mandatory software and how it is distributed. Mandatory software on assets is typically used for security or monitoring applications that are required on all assets.
The table shows
- Software title: The title of the mandatory software application, e.g. Nanitor Agent.
- Coverage: The fraction of assets where the mandatory software is installed. E.g. in the image above the Nanitor Agent (64-bit) is installed on 5 assets out of 18 where it is required.
The main use case of this widget is to get a quick idea of the state of mandatory applications. Note that in addition to this, software issues are created for each asset where a mandatory application is missing.
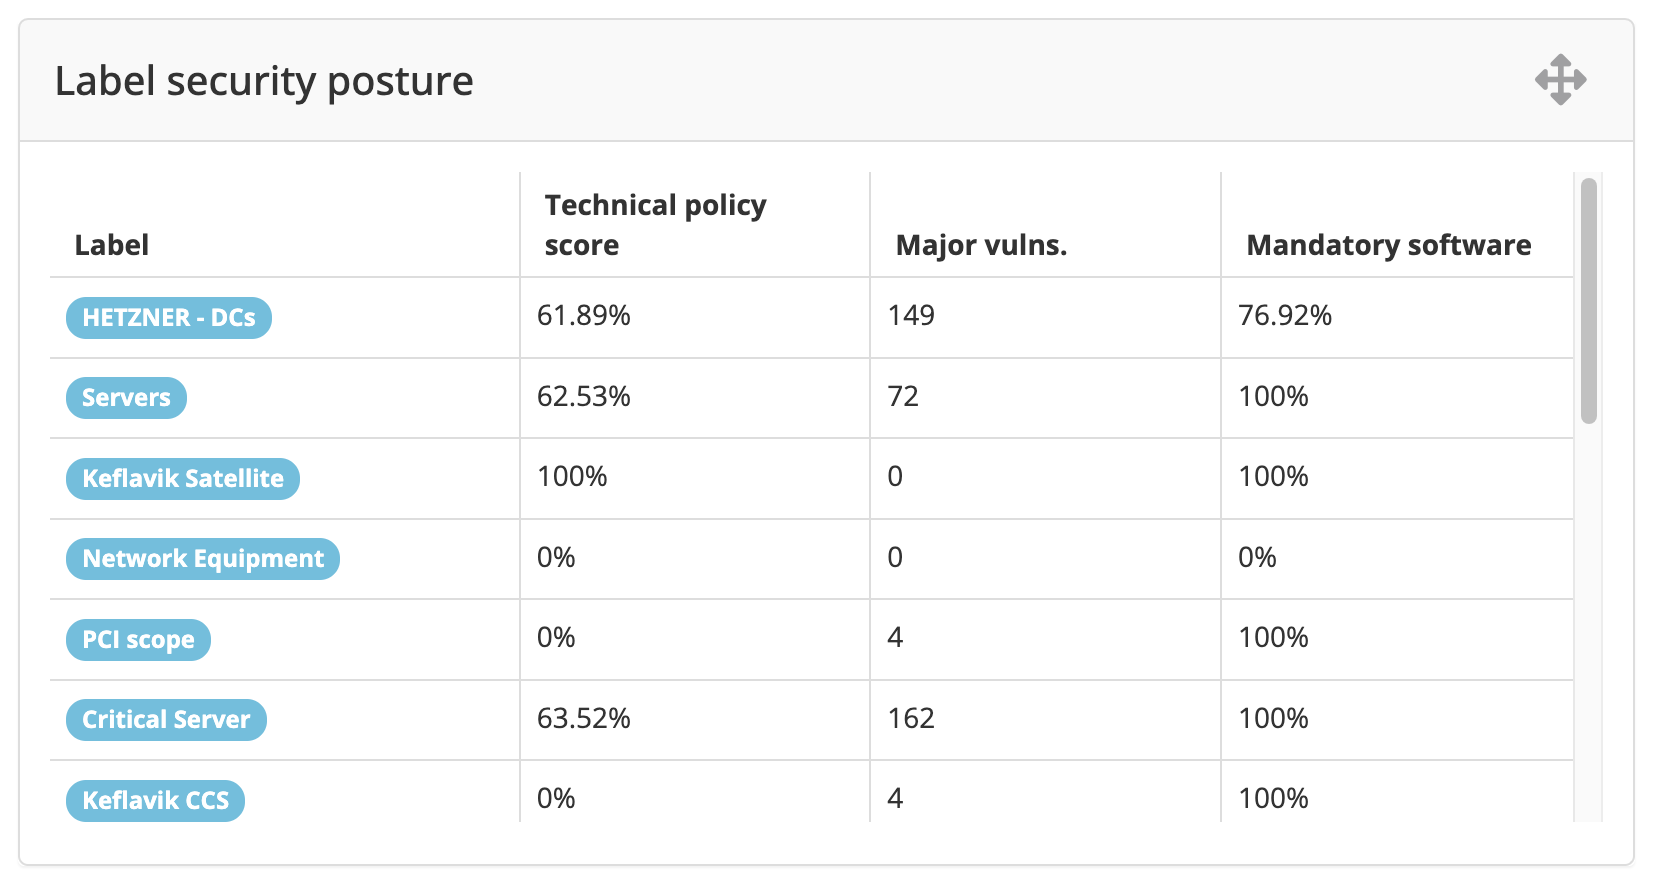
Label security posture widget
The label security posture widget is designed to give an overview of the security posture by label. Asset labels are typically used to group together assets belonging to a particular service, location, or team etc. This widget gives a comparative view of the assets within each label.
The table shows:
- Label: The name of the label
- Technical policy (a.k.a. baseline) score: The status of the security configurations of assets in this label.
- Major vulns: The number of critical vulnerabilities (CVSS3 base score over 9.0) on assets with this label.
- Mandatory software: The percentage of mandatory applications installed on assets with the label.
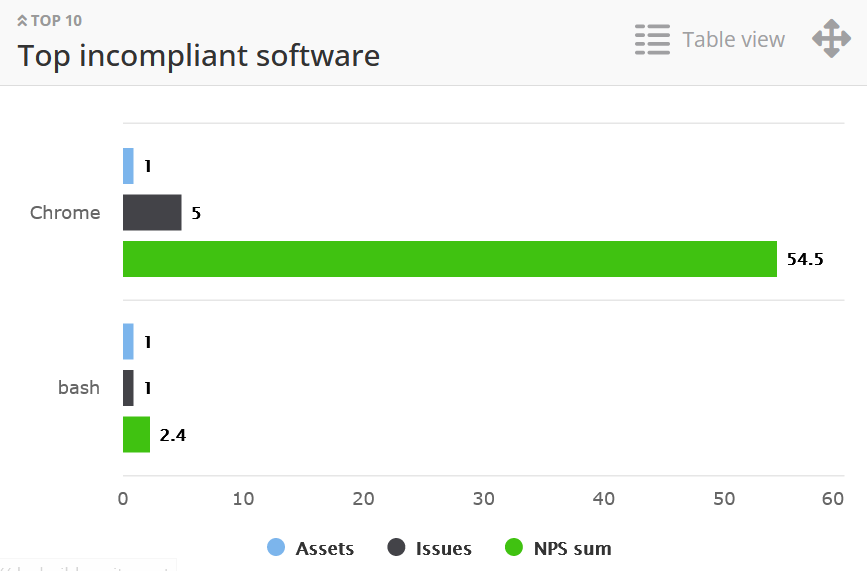
Top incompliant software widget
The top incompliant software widget is designed to give a visual overview of software titles having multiple associated issues.
The widget has two modes:
-
Table view: This mode represents information as a table with the following columns:
- Software title: Click the software title to open the Software Inventory and get more information about the software.
- Assets: The number of assets having the software installed.
- Issues: The number of issues related to the software (this includes vulnerability and in-compliant software issue types).
- NPS sum: The sum of all the Nanitor prioritization scores for the set of issues applying to the software.
-
Chart view: This mode shows the bar chart for software titles. You can select metrics to be displayed on the chart. By default, only the NPS sum is displayed. Click the metrics name below the chart to enable/disable its displaying.
To switch the view, click the view switcher in the top right of the widget header.
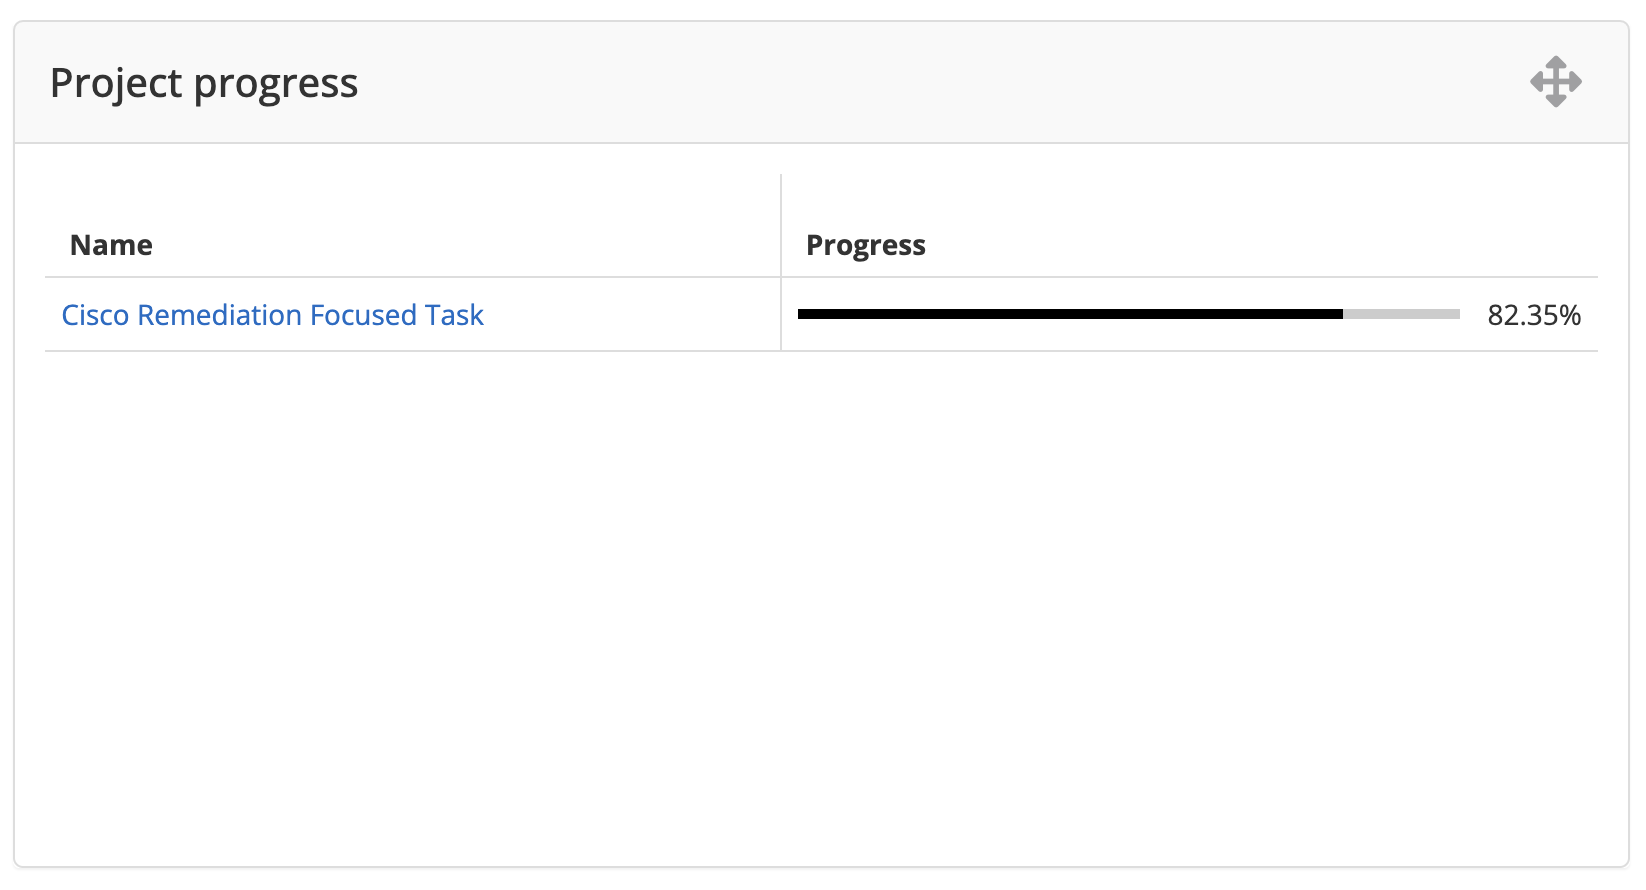
Project progress widget
The project progress widget is designed to give a quick overview of the ongoing projects and their statuses.
The table shows each ongoing project, along with its progress. For more detail the user can then click on the project, or go to the Projects page (Issues -> Projects).
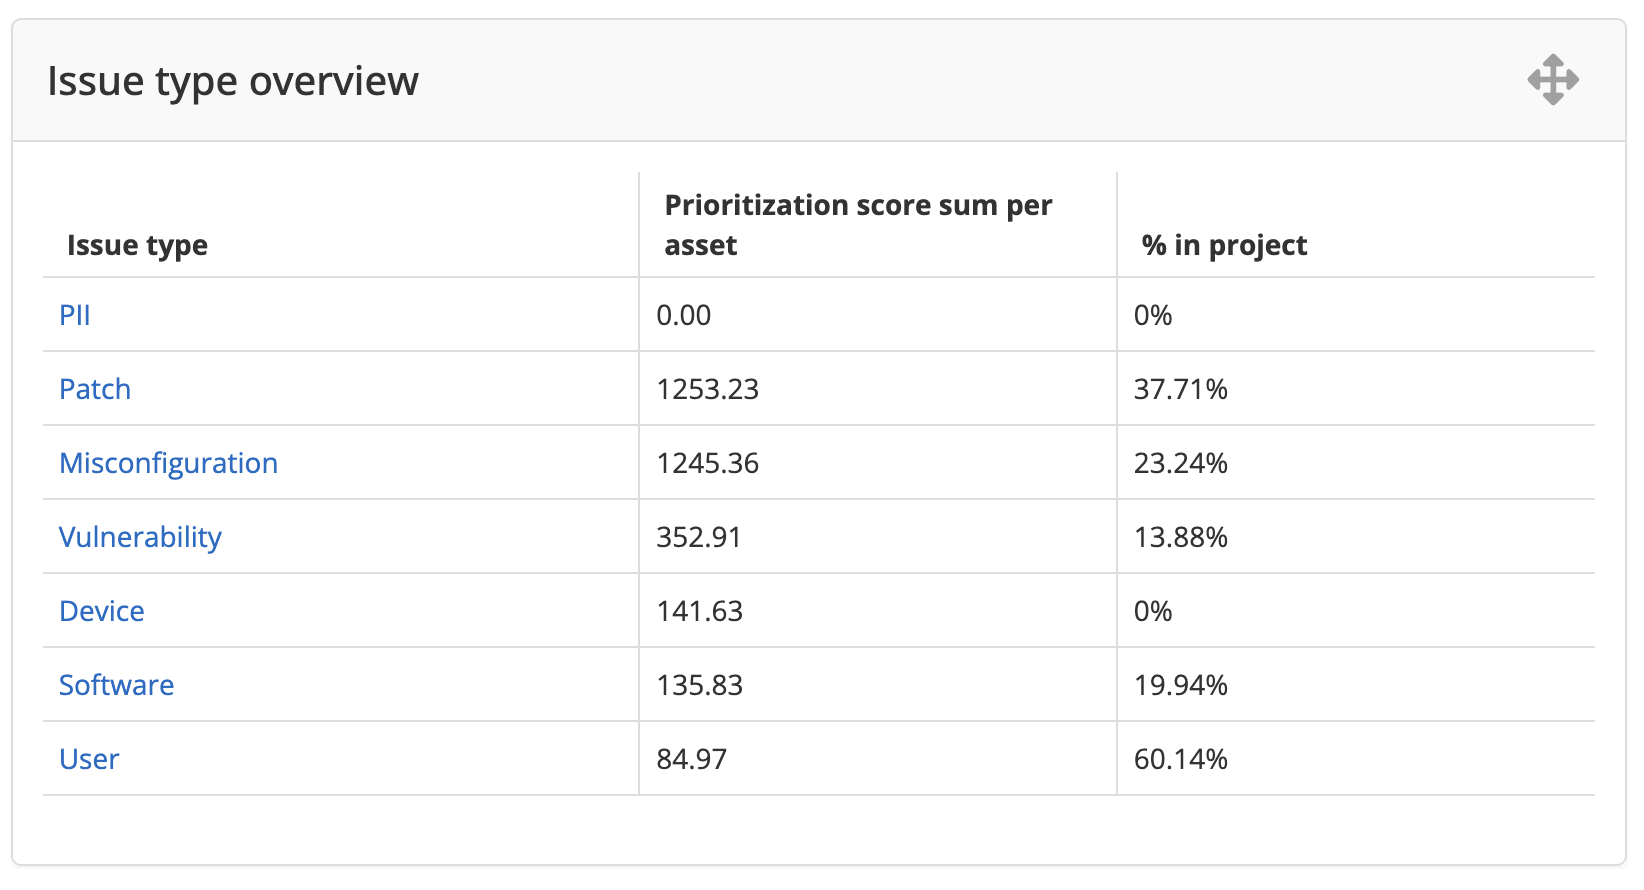
Issue type overview widget
The issue type overview widget is intended to give a quick overview of each issue type and give an idea of the issue magnitude and how much is assigned to projects. The table shows:
- Issue type: The name of the issue type.
- Prioritization score sum per asset: This is indicative of the issue magnitude, i.e. not only counting issues but taking priority into account. It is divided by asset count to give a more normalized value that can be compared across issue types.
- % in project: This shows how many of the issue violations are assigned to a project.
The main use case of this report is to get an idea of what issue types are mostly affecting the organization, and whether the issues are assigned to a project. It can be useful to check this widget and ensure that issues are assigned to projects. The user can also click the issue type to get a list of the issues, and from that list assign issues to projects.
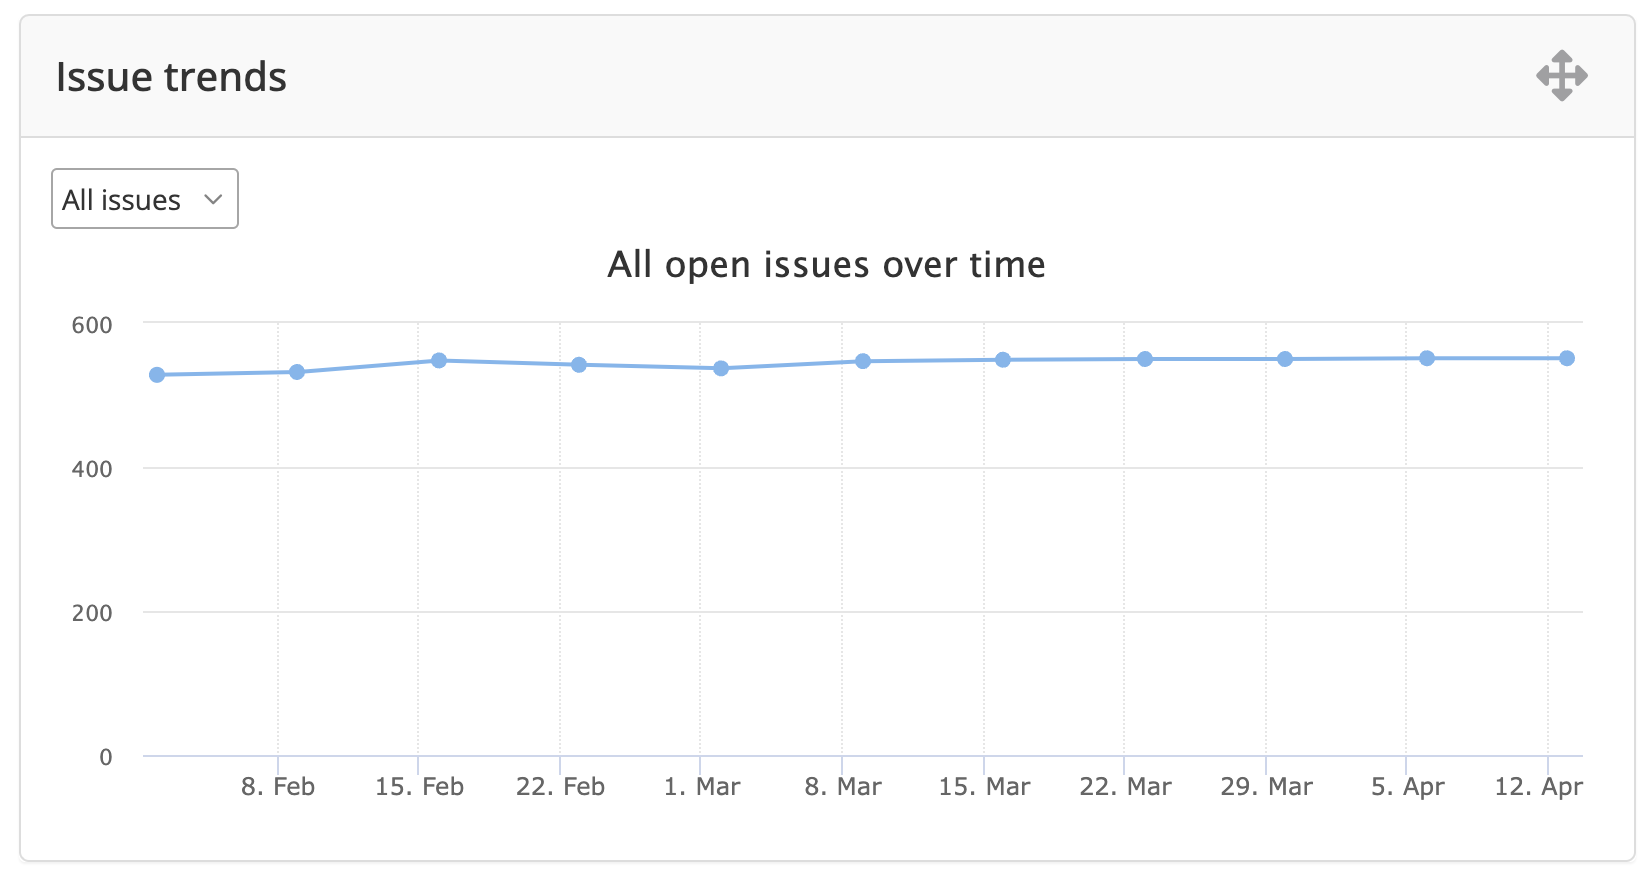
Issue trends widget
The issue trends widget is designed to give an overview of how issues are progressing over time. Ideally, this curve should reflect the ongoing work of system maintenance, i.e. issues are discovered and then resolved.
By default, the graph shows a chart for the total count of all issue types. To view/hide trends for individual issue types, click the corresponding labels below the chart.
