Nanitor UI
Welcome to our guide on the user interface (UI) of Nanitor. The user interface is a crucial component of any software, as it determines how users interact with the application and how they perform tasks. A well-designed UI can make the difference between a frustrating, confusing user experience and a smooth, intuitive one.
In this guide, we'll walk you through the various elements of the UI, from menus and filters to dialog boxes (modal windows) and panels. We'll explain what each element does, what use case it is designed for, and how to use it effectively.
Whether you're a new user of Nanitor or a seasoned pro, this guide will help you get the most out of the application and streamline your workflow. So let's get started and explore the world of Nanitor UI together!
Areas of Nanitor
Nanitor is built up in a similar way throughout the entire application. The Nanitor UI is divided into several areas as shown in the screenshot below:
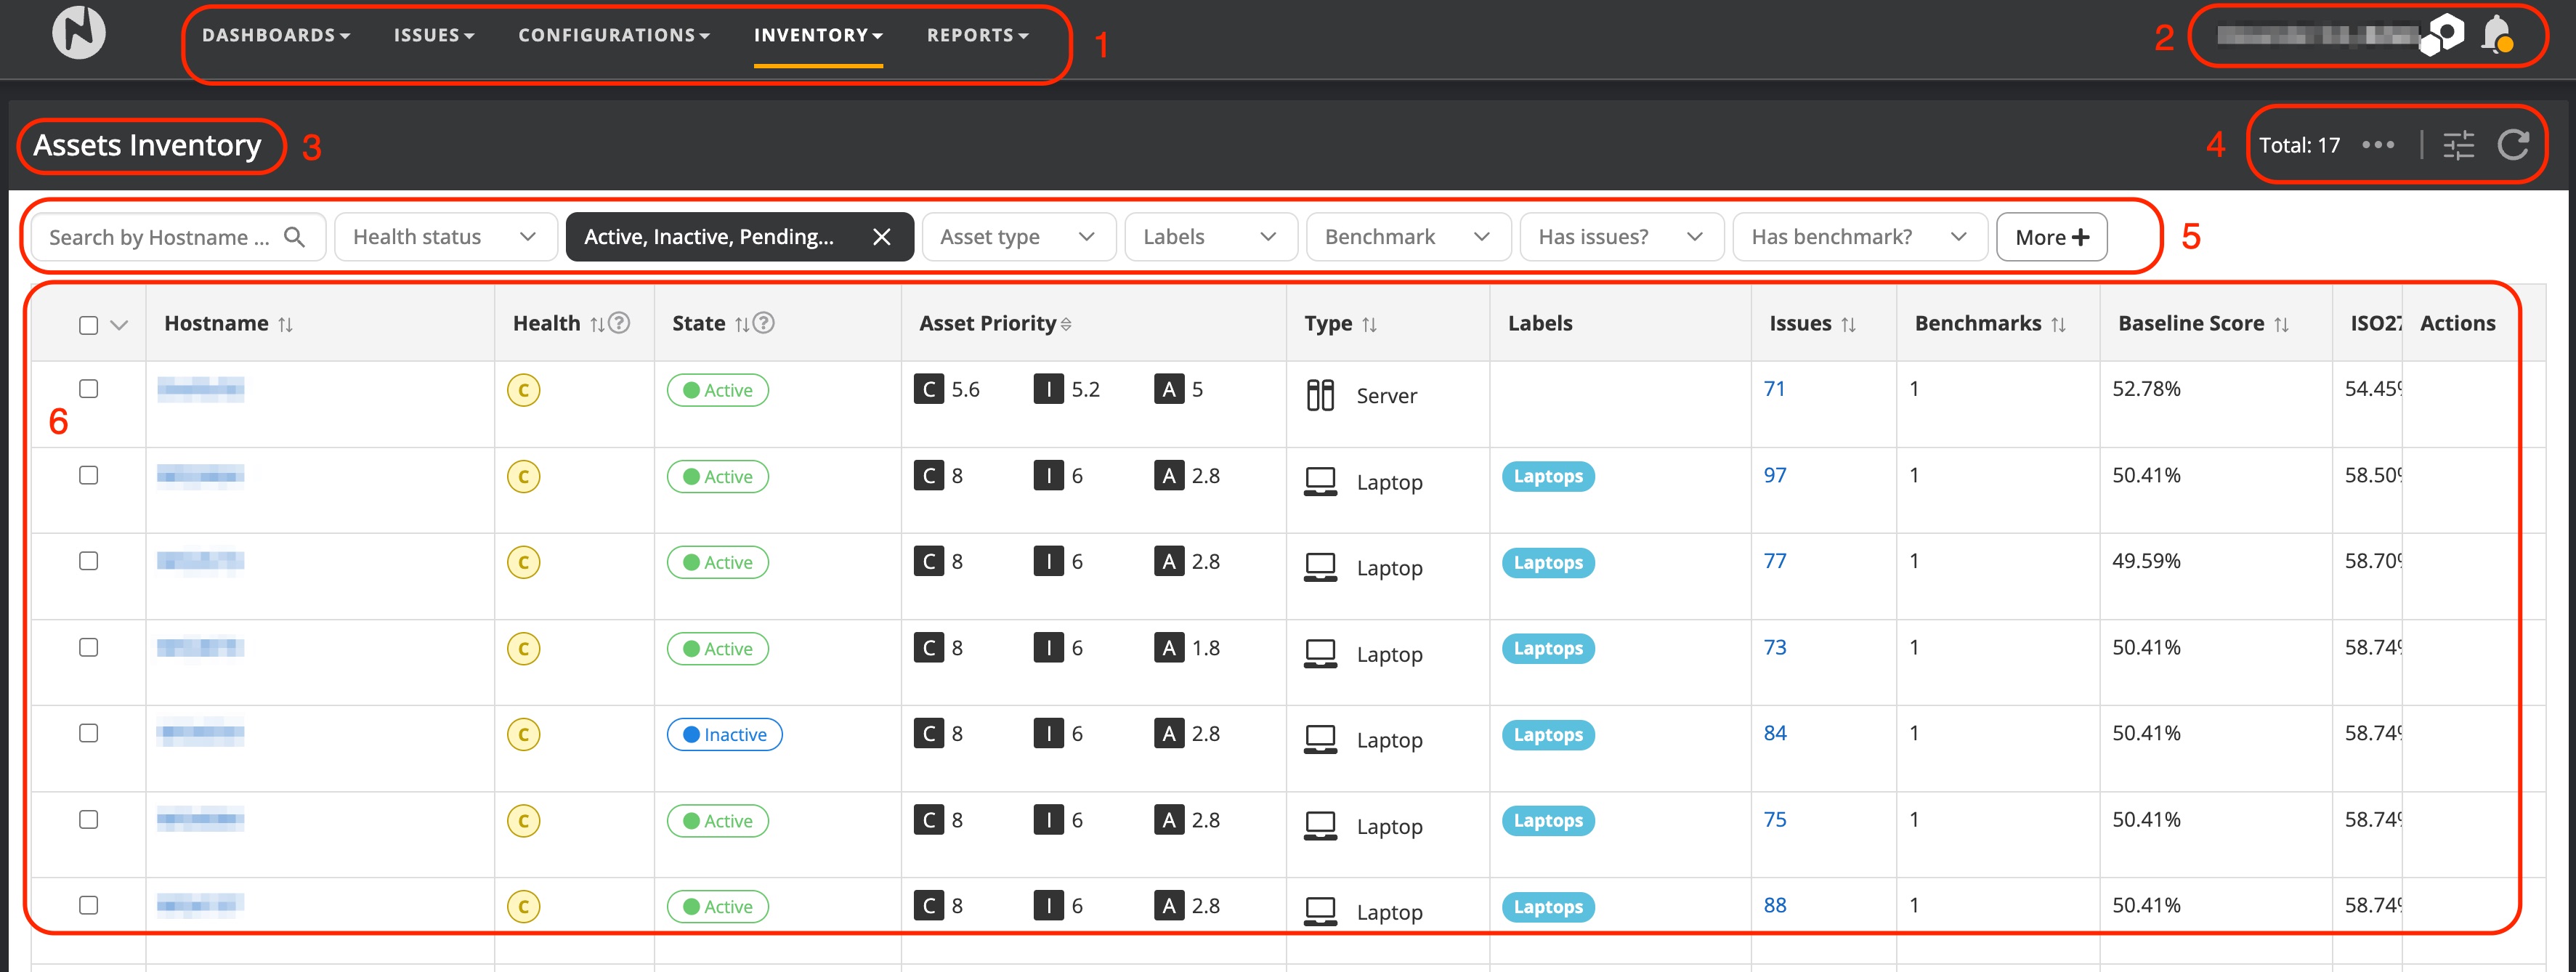
- On the top you will find the navigation menu. The menu is organized into several topics. What to find under each menu item is explained in the section below. The main navigation area consists of
- Dashboards
- Issues
- Configurations
- Inventory
- Reports
- Your username and the site name are displayed along with a link to the notification center in the top right corner.

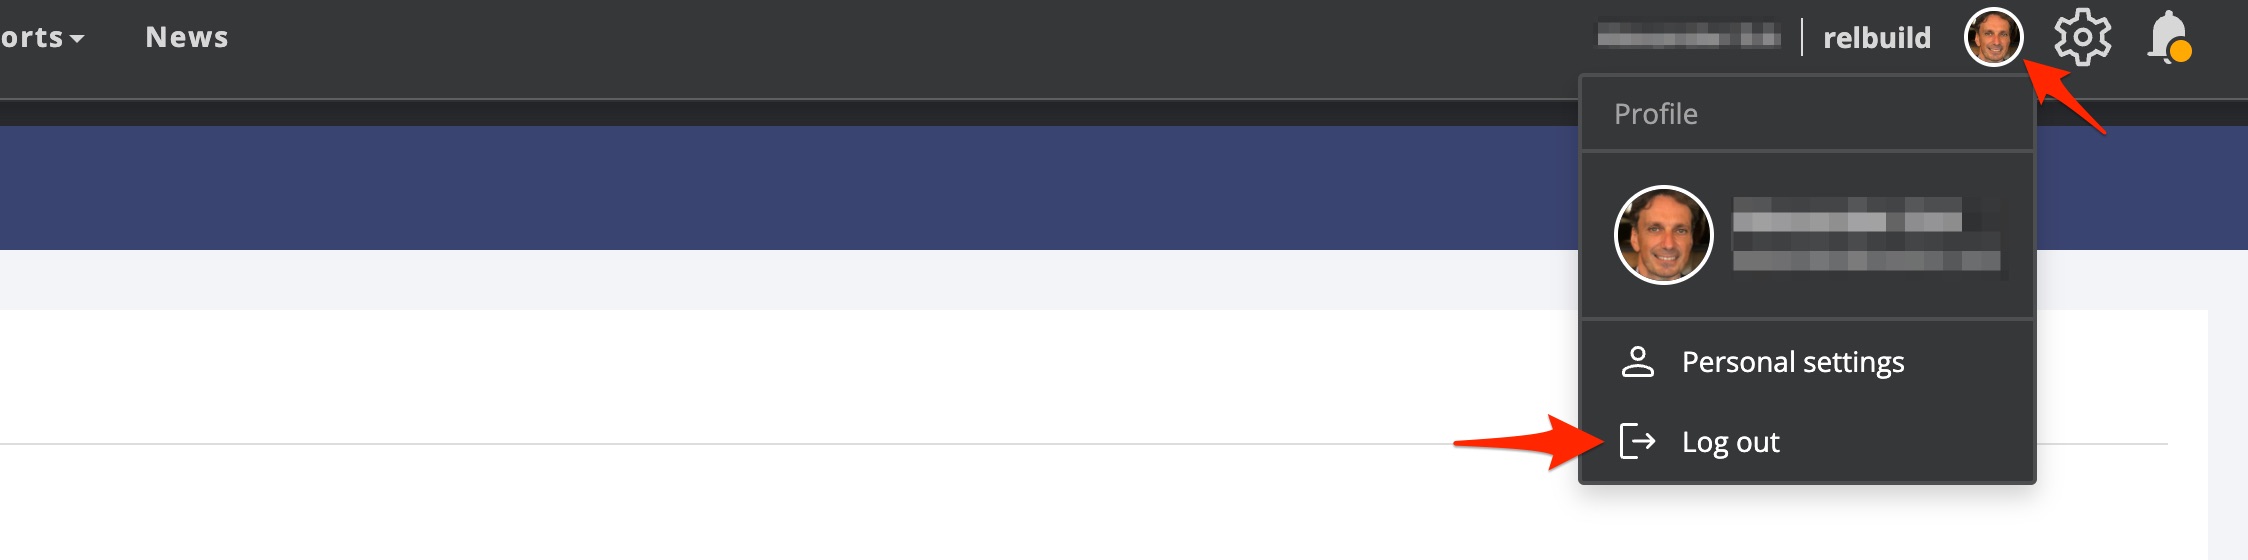
Clicking on the username, the site name, or the configuration icon (1) will navigate you to the configuration menu of Nanitor
Depending on your user role (administrator or guest user) you might only have access to a subset of the menu items shown in the screenshot below.
If your organization is managed through a user provider the System Management area will be blank.
On the top right corner you will find a button to log yourself out of Nanitor.
Clicking on the notification icon (2) will open the notification center
- Below the header area with the navigation menu you will see what area you are actually working in. That is the menu item you have selected from the navigation menu. This is for information purposes only
- On the right-hand side of the navigation information area there is an action area that refers to the data area (6).
 . There you will always see how many records are returned from the selected menu item or from an applied filter (1). Depending on the area where you are located you will get a list of available actions that can be applied to the items returned in the data area (2). The kind and amount of available actions depend on the nature of the subject (eg. issues, assets, etc.). The customize button (3) allows you to adjust the visible columns of the data area. Not all areas allow an adjustment of the column setup. It is mainly headed towards topics where much information is available (assets, issues). The refresh button (4) allows a refresh to bypass the cache and fetch a new set of data from the Nanitor database.
 - Below the information area and on top of the data area there is the filter area that allows searching for specific items or a set of items from the selected working area. A better explanation of how the filters work can be found below.
- The main area is the data area where you can find all detailed information on depending where you have navigated to. The data area consists of a table containing detailed information on records returned from the Nanitor database. It is not applicable for sections displaying reports, dashboards, or other areas like the security configuration section. The data area is described in more below.
Menu
The Menu consists of 5 main areas. Inside each menu can be several submenus allowing one to view further information
- Dashboards are intended to provide a high-level overview of the status of your IT infrastructure. All dashboards contain several widgets displaying key information from various security angles
- The Overview dashboard is a good place to poke around for all kinds of information across Nanitor. It covers assets, the monitoring status, security configuration scores, patching, and software status for example. The dashboard provides good insights for all areas covered by Nanitor and should give quick insights on important security matters.
- The Health Status dashboard is focussed on the organizational IT security health broken down for each area (configurations, patching, vulnerabilities, etc. )
- The Progress dashboard is meant to report on the progress made towards a more secure IT environment. It helps to understand the pace at which IT security gets improved and should inform at what time a healthy security state will be achieved and how your organization is able to maintain the current state of IT security
- Issues are the key concept of Nanitor and represent a possible security threat to your IT infrastructure. All issues can be displayed from:
- The Issue diamond that places the issues in a 45-degree rotated 10 by 10 square where the most severe issues are located at the top. The color index adds an additional visual way to display the most severe issues. The issue diamond gives a very quick view of the number of prioritized issues.
- The Issue list is a flat list of issues that are sorted by default by the prioritization score of the detected issue. The issue list is dedicated to an in-depth analysis by filtering issues on all kinds of attributes.
- Projects are used to manage remediation work for detected issues in Nanitor and are essential for an effective way to increase IT security in a short time period and in an organized way by resolving IT security issues that have the greatest impact on overall security health.
- Configurations refer to operating system benchmarks issued by the Center of Internet Security (CIS). Nanitor compares the recommended settings from CIS with the configuration settings on the assets monitored by Nanitor.
- Security Configurations is a list of all detected CIS benchmarks from Nanitor agents and Nanitor collectors. Each CIS benchmark is given a score in accordance with amendments of the CIS controls made by you (baseline score), and a weighted compliance score for your primary compliance framework target.
- The Configuration trends page shows the development of the tracked CIS benchmark scores over time. It is a good indicator to view the progress being achieved in hardening the asset fleet by adjusting the configuration settings according to the recommendations from CIS.
- Configuration changes display a detailed list of all configuration settings that have been changed in the IT environment either if they have failed or passed.
- The Inventory shows all findings of the Nanitor agents and collected devices in an organized way. It splits the collected information into various areas.
- The Assets view lists all assets covered by Nanitor. Either if they are monitored in an organized way by an agent installed on the device or retrieving information from a Nanitor collector. The asset inventory will also list all discovered devices on available networks that Nanitor agents have been distributed to if that feature is enabled. The asset inventory list is valuable as an asset management tool. It allows filtering assets throughout the entire IT environment on various attributes (security health, operating system, CIS benchmarks, etc.) and exporting to a commonly used CSV format.
- The Networks view list all discovered networks from the Nanitor agents. You can gain information on how many assets have been detected on each network.
- The Users inventory shows a list of detected users on the monitored assets. As an example, the users' list helps to identify which users have access to which assets, when they have last logged into an asset, and what privileges they have on each asset.
- The Software inventory lists all 3rd party software used on the assets when software detecting is supported on the operating system and they are installed in the application directories used for the operating system. The software inventory lists help to identify the most insecure software and what versions of which software are in use. Nanitor can identify outdated and not wanted software in the IT infrastructure.
- Known vulnerabilities is a list of vulnerabilities (issues with a CVE number) known by Nanitor. From the list of vulnerabilities, you can check on certain vulnerabilities that you have heard of or read about. It is NOT a list of detected issues but it helps to understand if Nanitor is not detecting a vulnerability to cross-check if the vulnerability is being checked by Nanitor.
- The list of Open Ports are ports that have been detected as open by the Nanitor agents. That helps to identify assets that are exposed with an open and commonly used port (eg. 80, 8080, 22) that should preferably be closed. Within Nanitor you can set port rules that will flag an issue for you (this feature needs first to be enabled from the configuration menu).
- Reports
- The User Audit report shows a list of detected users on the monitored assets and groups them into various problem areas. Nanitor will flag administration accounts, stale users, users without an expiring password domain admins, and local admins.
- The Compliance Issues report maps detected issues to a chapter within a compliance framework. Nanitor supports a wide range of compliance frameworks (ISO27001, PCI, NIST, etc.). What compliance frameworks are enabled can be viewed from Organization Management → Settings → Compliance. Nanitor is mapping issues to a chapter in each compliance framework if applicable. The compliance issue report lists all issues found in each section of a compliance framework grouped by the issue priority group (P0, P1, or P2). The report should give you a good indication of how compliant you are towards a specific compliance framework. That might be the case when no P0 or P1 issues are detected with any relevance to a chapter in a compliance framework.
- The Issue Exceptions reports list all exceptions made and released on issues. Excluded issues are by default hidden from the issue views in Nanitor. To view issues in the issue views you will need to include "excluded issues" from the issue filter option. The issue exceptions report list all existing exceptions and when applicable for what labels they have been excluded and when an exception is due to expire.
- The Technical policy changes report captures all changes made to the security configuration settings. It tracks all changes when a setting has been excluded or enabled for a security configurations benchmark.
- The Issue trend metrics report is an issue statistics report that displays data in a graphical way. The report collects data from the last year and groups them by month. The issue trend metric report has multiple widgets available and breaks the filtered data down into issue types, device types, or priority group levels.
- The Patch status report is a valuable report to identify missing patches on assets. Missing patches are categorized as patches that are overdue (have not been installed 30 days after the patch has been reported as missing on an asset) and not overdue (patch has been reported missing within the last 30 days).
- The Group policies report lists all installed Group policies (GPO) on all monitored assets. That helps to identify all installed GPOs and see which assets have a GPO applied.
- As an auditing tool the Activity log is a database of all events logged by Nanitor. Loggings are separated between audit logs that keep track of user logins when monitored assets are added or removed and keep track of software and patches installed or removed on assets. The security logs track all kinds of events related to issues in Nanitor. All auditing events can be filtered and the selected filter status be exported to a CSV file.
Filters
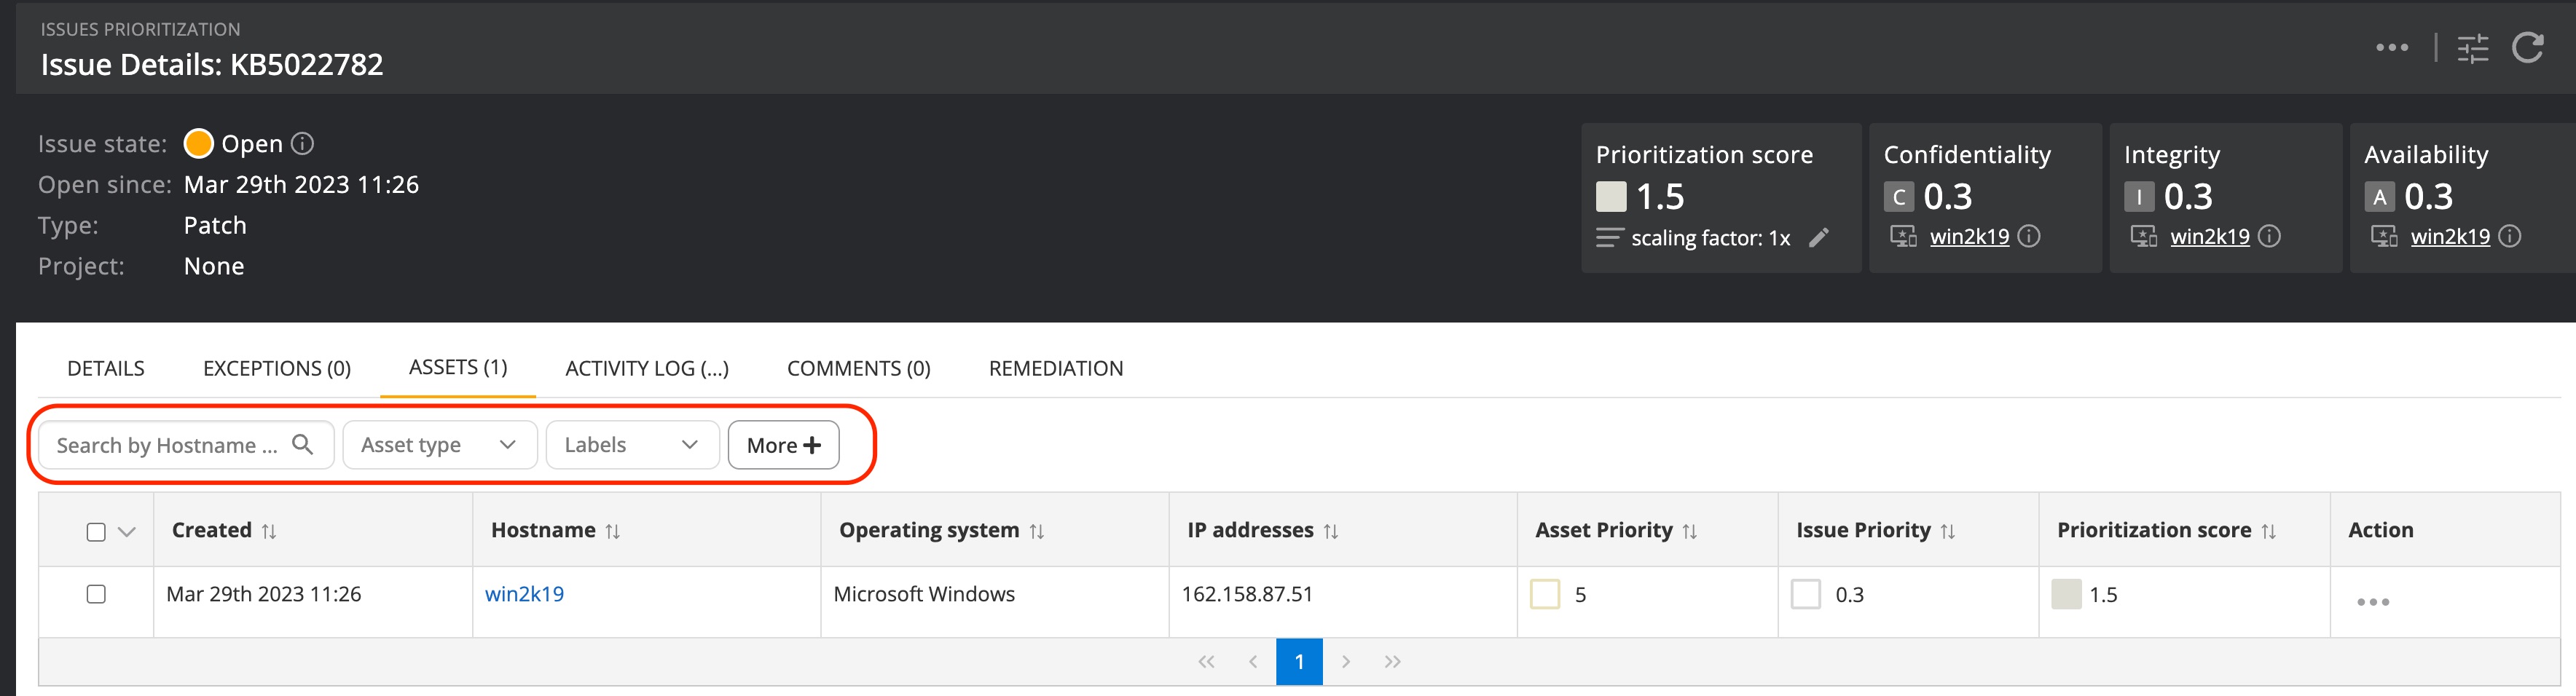
Each view in Nanitor has on most occasions the possibility to filter the returned results. Depending on the area you are working in the available filters have multiple parameters that can be leveraged for filtering. The example below shows the filter in the issue view presented above the data area returning all results that have been filtered.
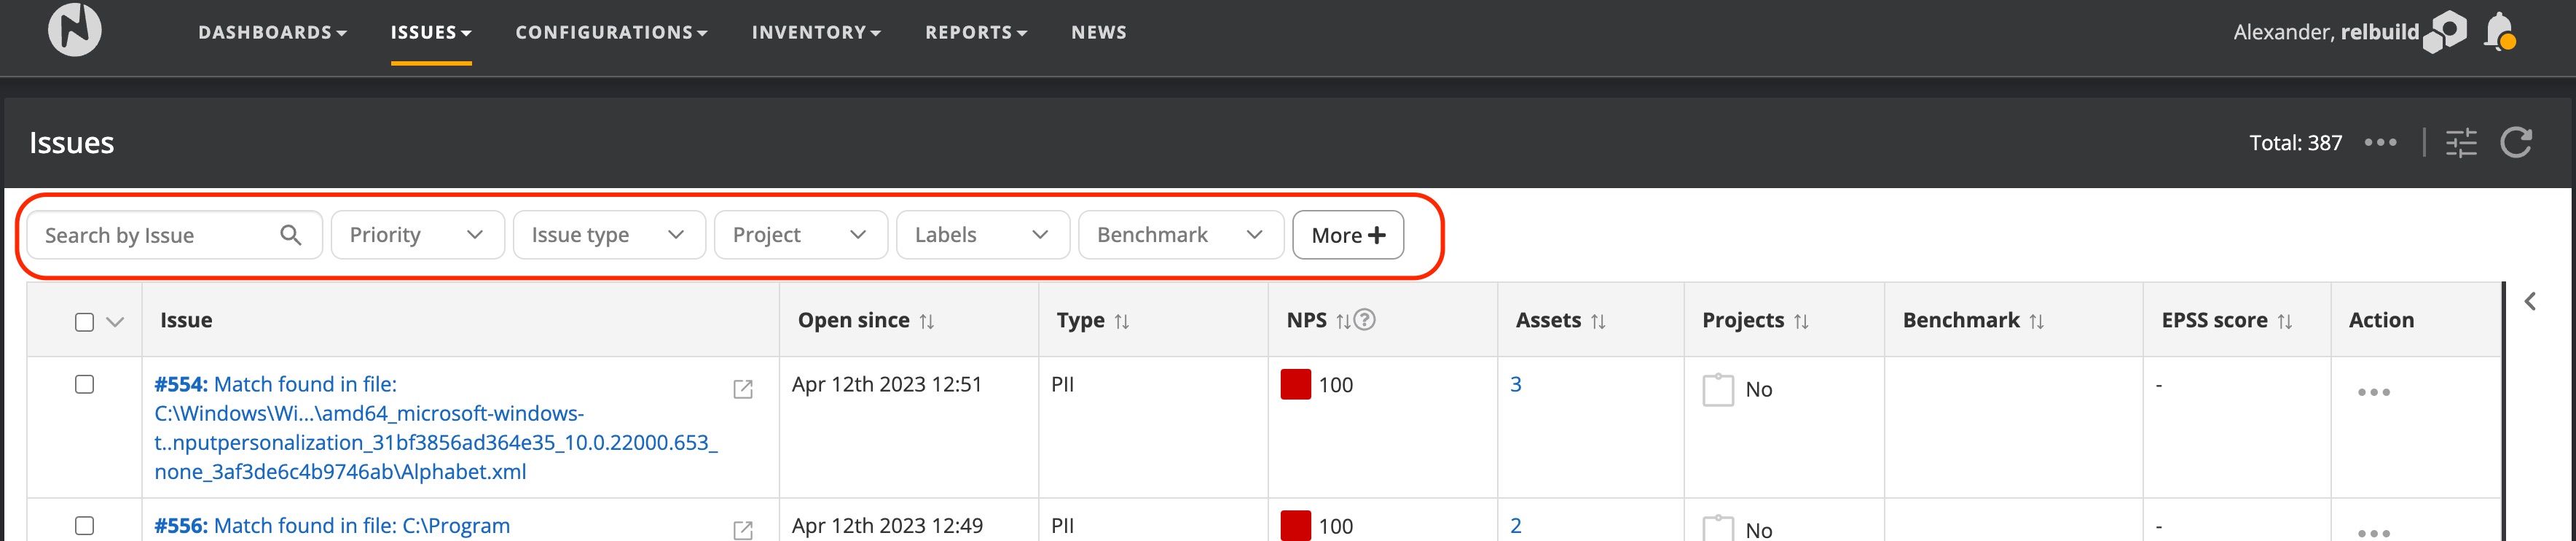
Nanitor returns by default a set of data that represents the most valid use case. In the issue filter for example all issues that are closed or have been excluded are not included in the list of issues. A filter can also be present in a tab of an issue, asset, or report.
 .
.
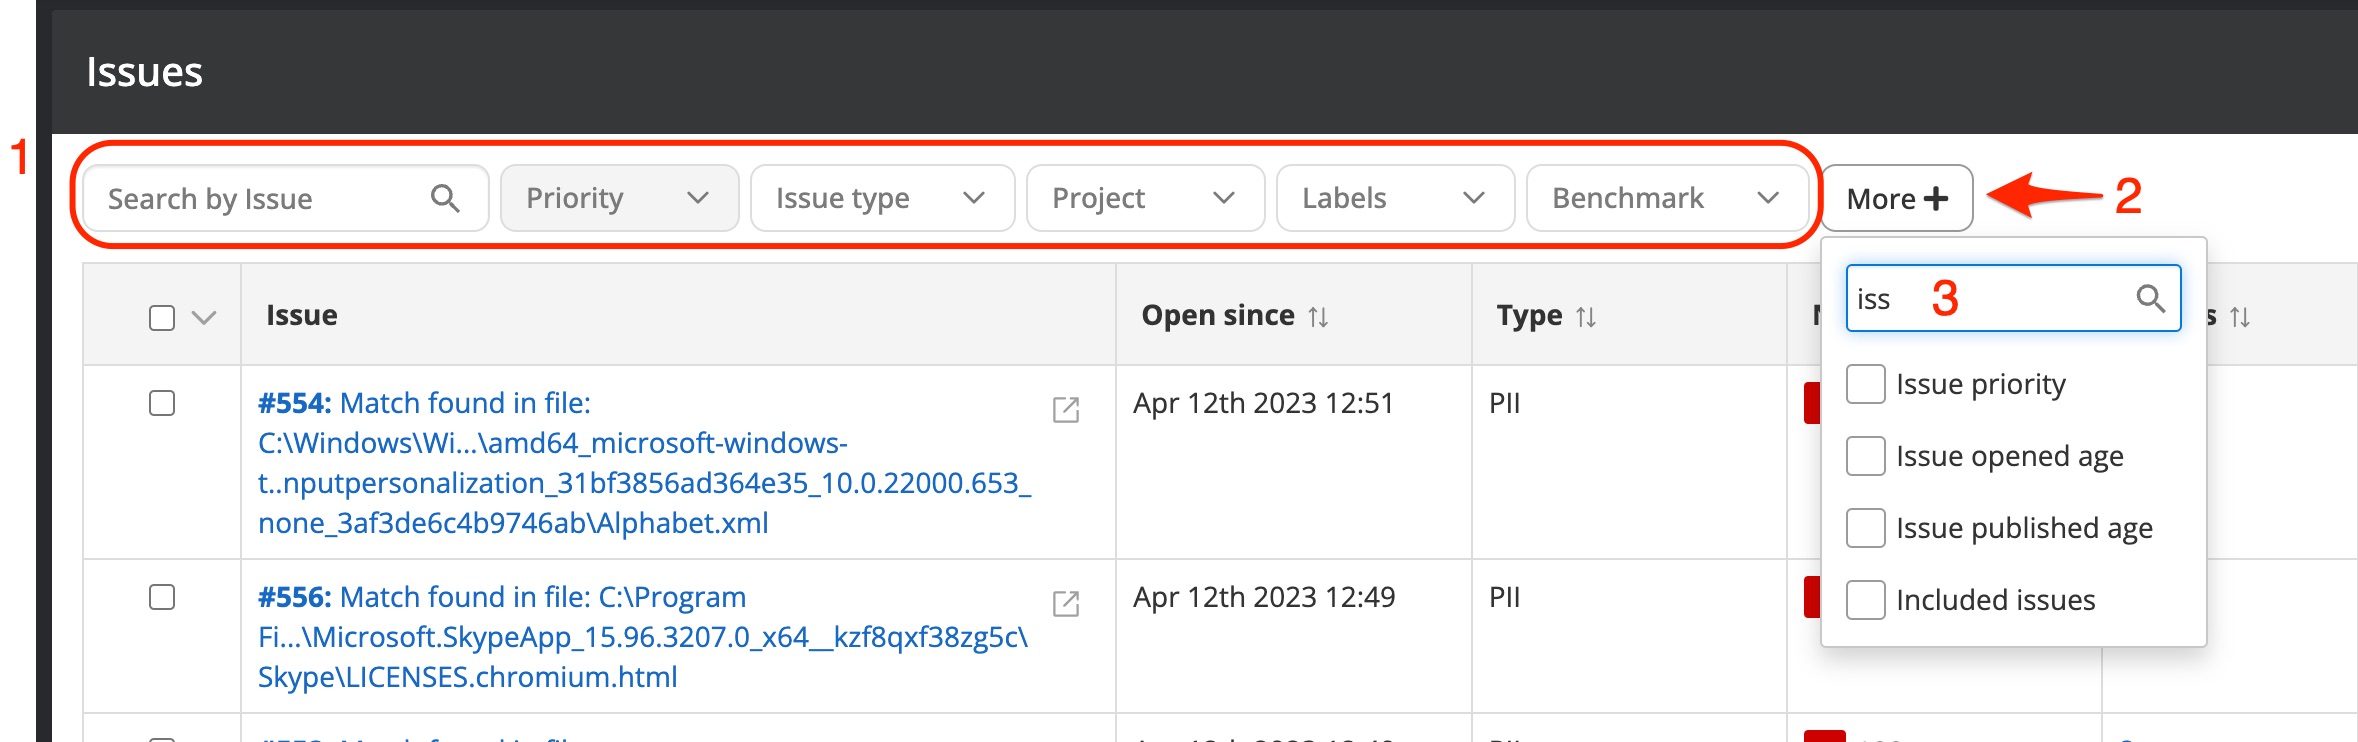
A filter can limit the search based on many parameters. The available parameters can be extensive depending on the subject that is being filtered. The list of issues has more parameters available than a list of security configurations. Nanitor only displays a basic set of filter parameters that are mostly used. When there are more parameters available than displayed in the UI there will be a More button (2) where you get a list of all available parameters. The list supports autocomplete once you start typing, you get a list of matching parameters available.
Most of the issue parameters allow a multi-selection of values to be selected.
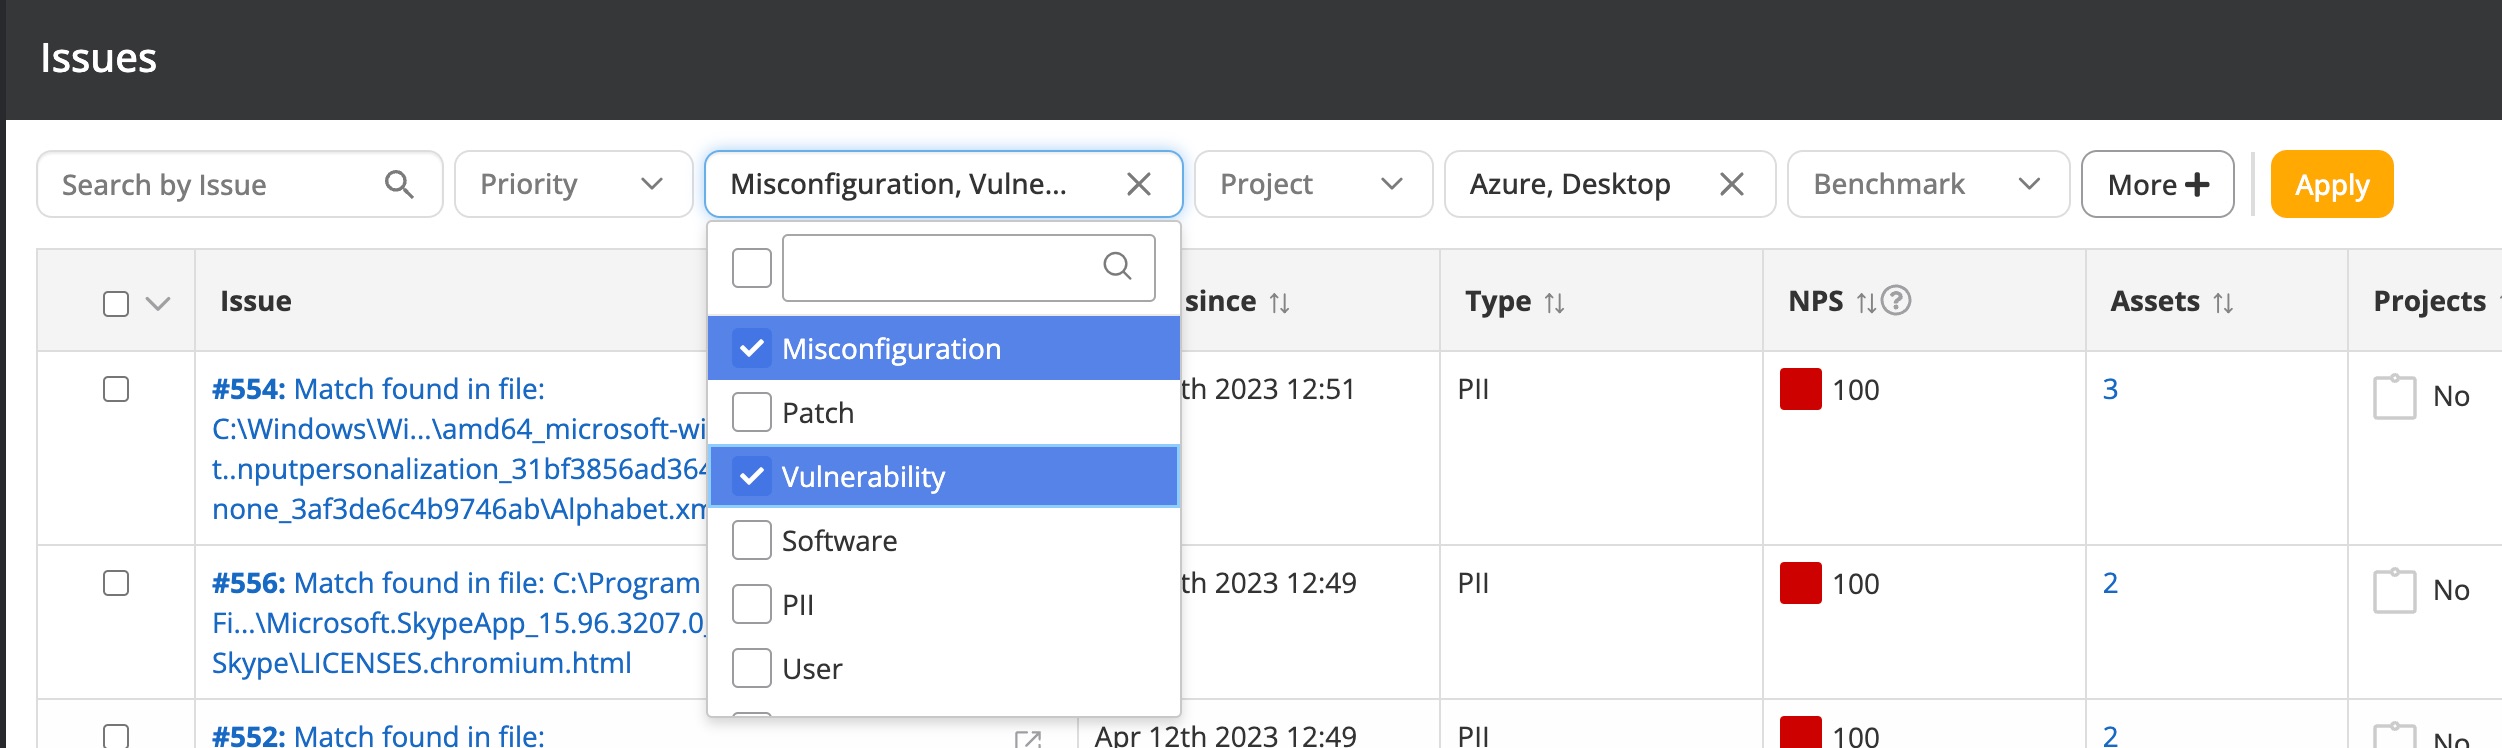
Once you have done your selections you will need to confirm your selection by pressing the Apply button.
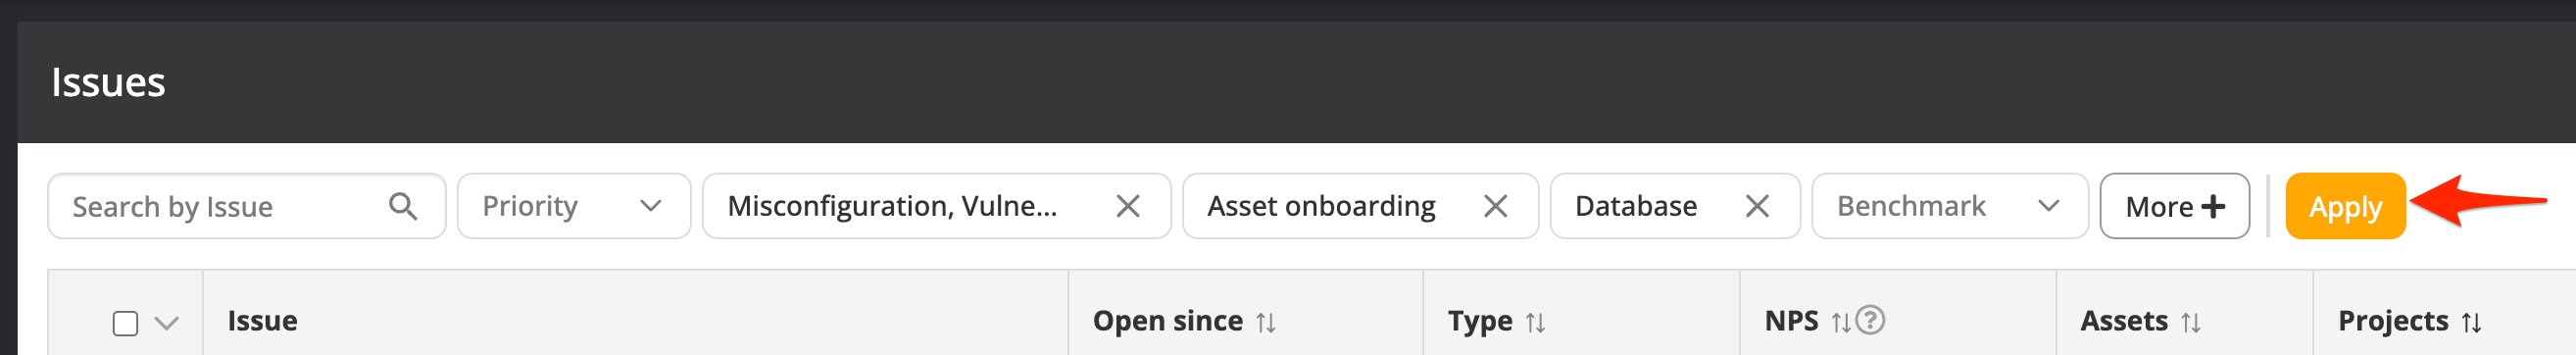
After you have applied your filter selection the filter parameters with a filtered value get colored.
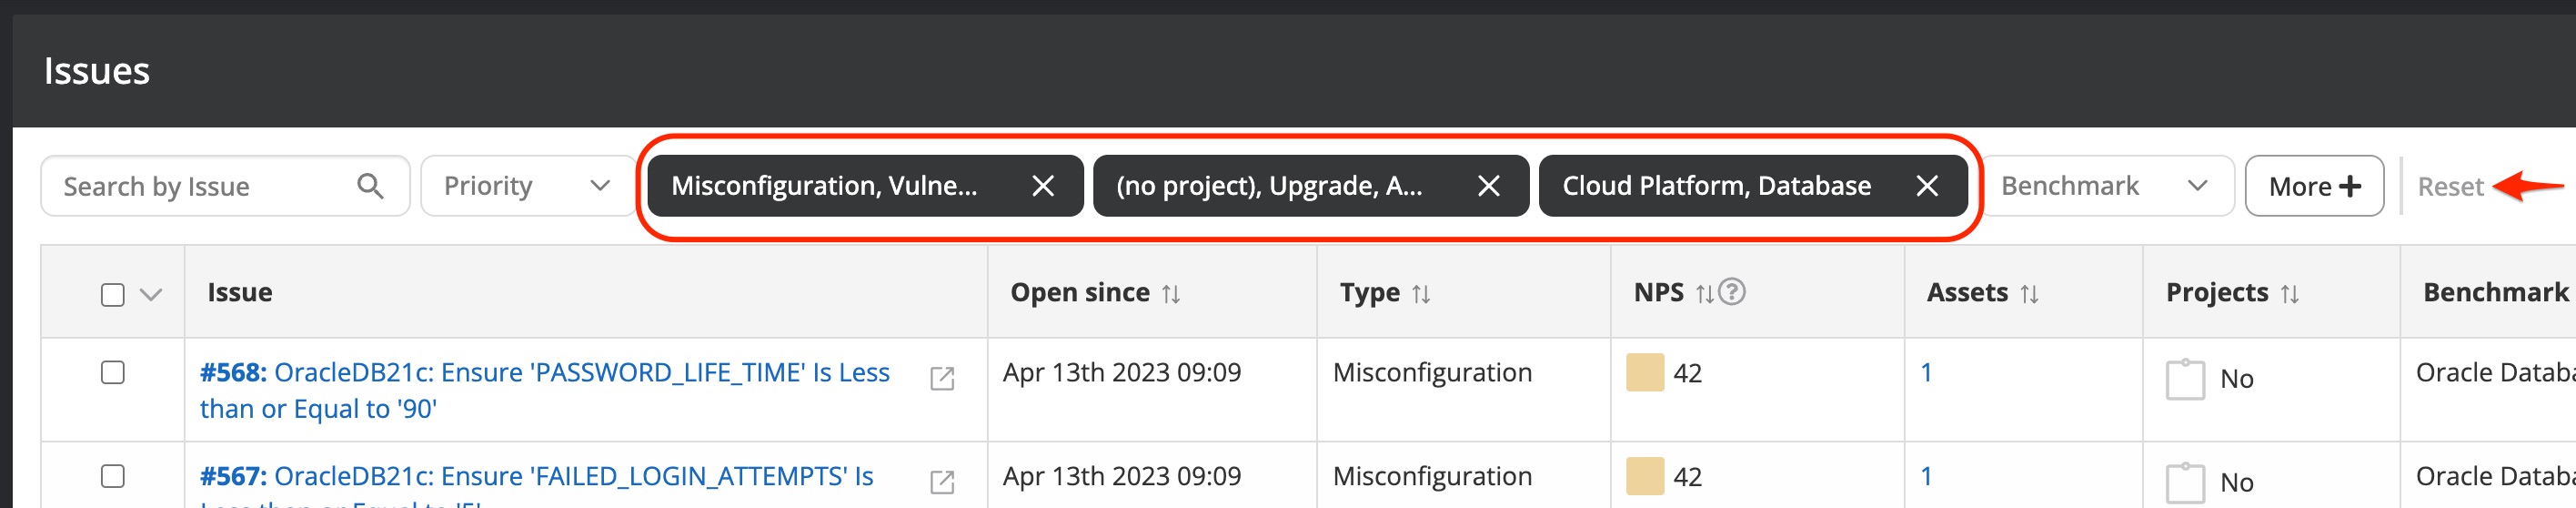
The Apply button will disappear unless you make further changes to the selected filter options. Instead, you will get a Reset button that will clear all applied filters and return to the default applied filter.
Saving filters
To save you time filtering on the list of issues or assets that you are interested in, you can save a set of filter options as a saved filter. This allows you to quickly access a list of issues or assets that you regularly view at any time later. For example, if you want to switch to a view of all vulnerabilities that have been detected in your environment within the last 20 days, you can do so. First, apply the filter of your choice on the issue list.
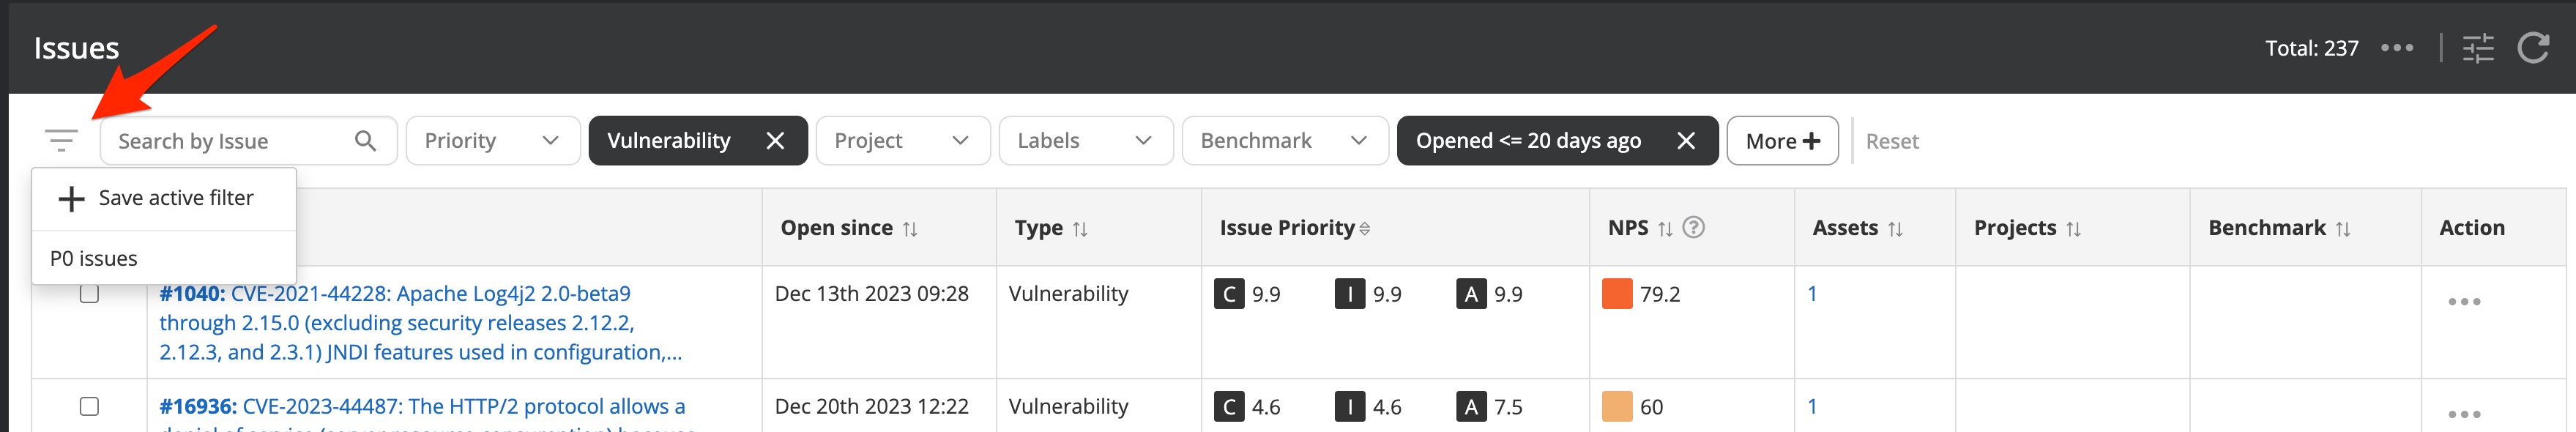
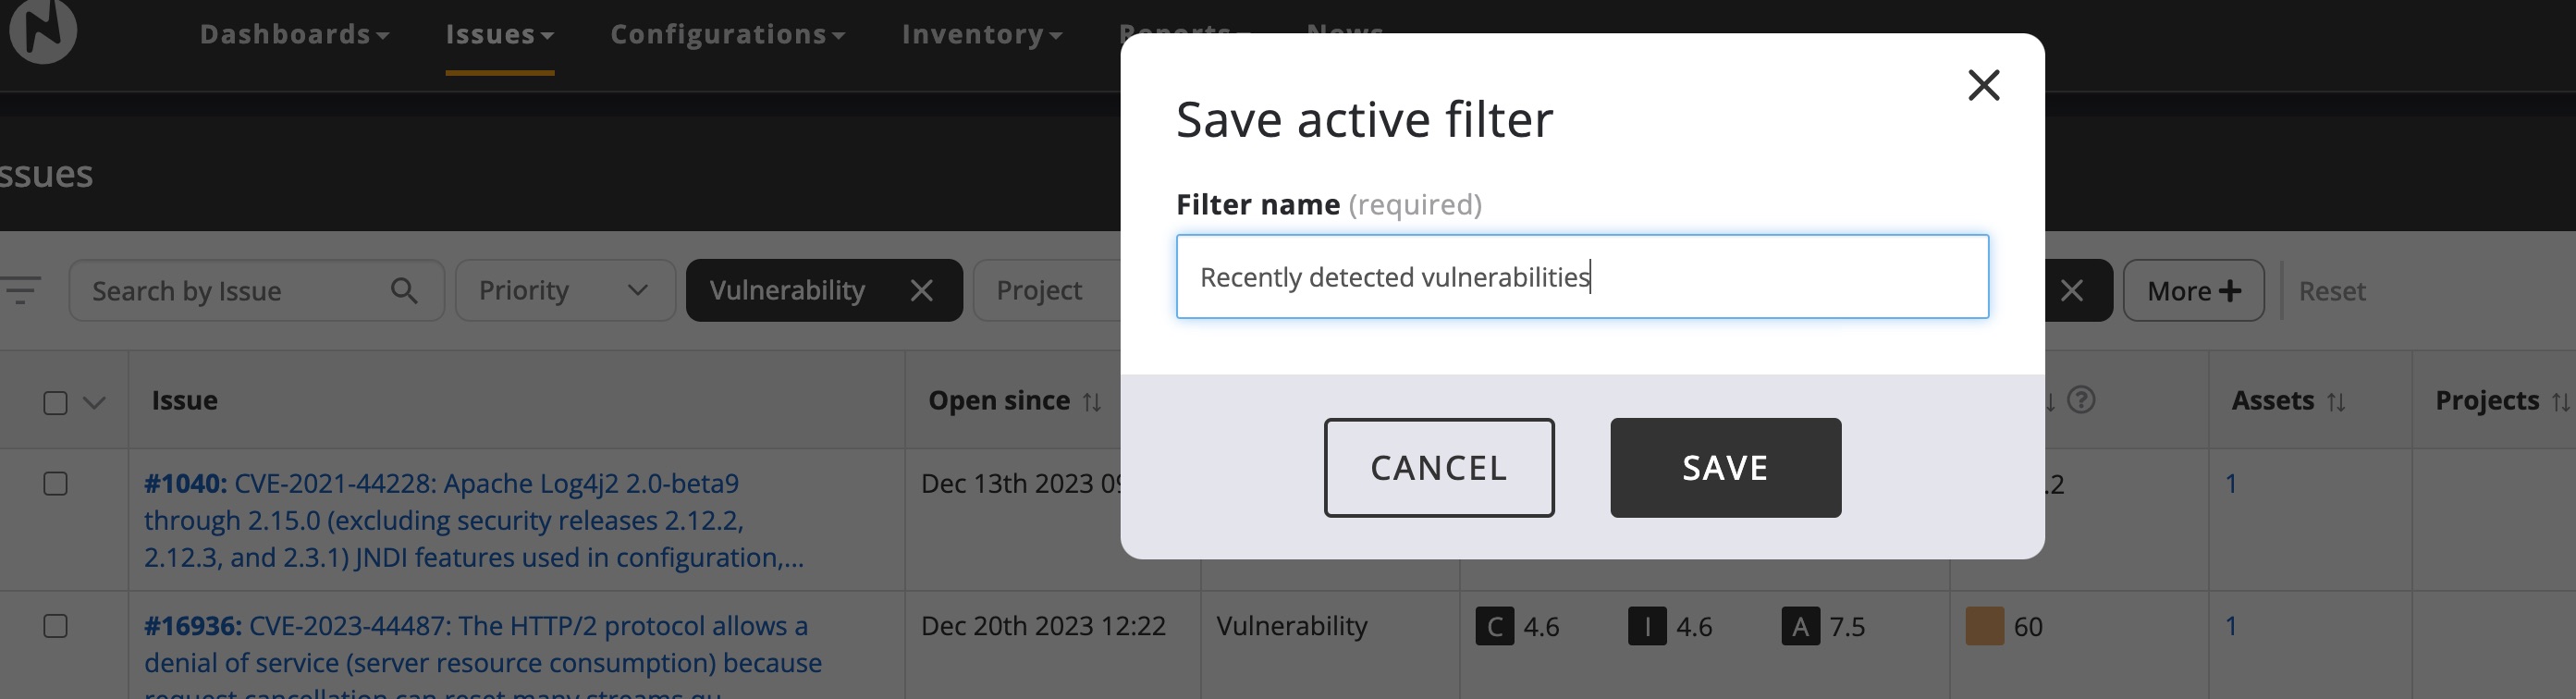
Next, click on the filter icon on the top left and save the filter options as a saved filter. From the filter menu, select Save active filter. In the upcoming modal window give the filter a descriptive name and press Save.
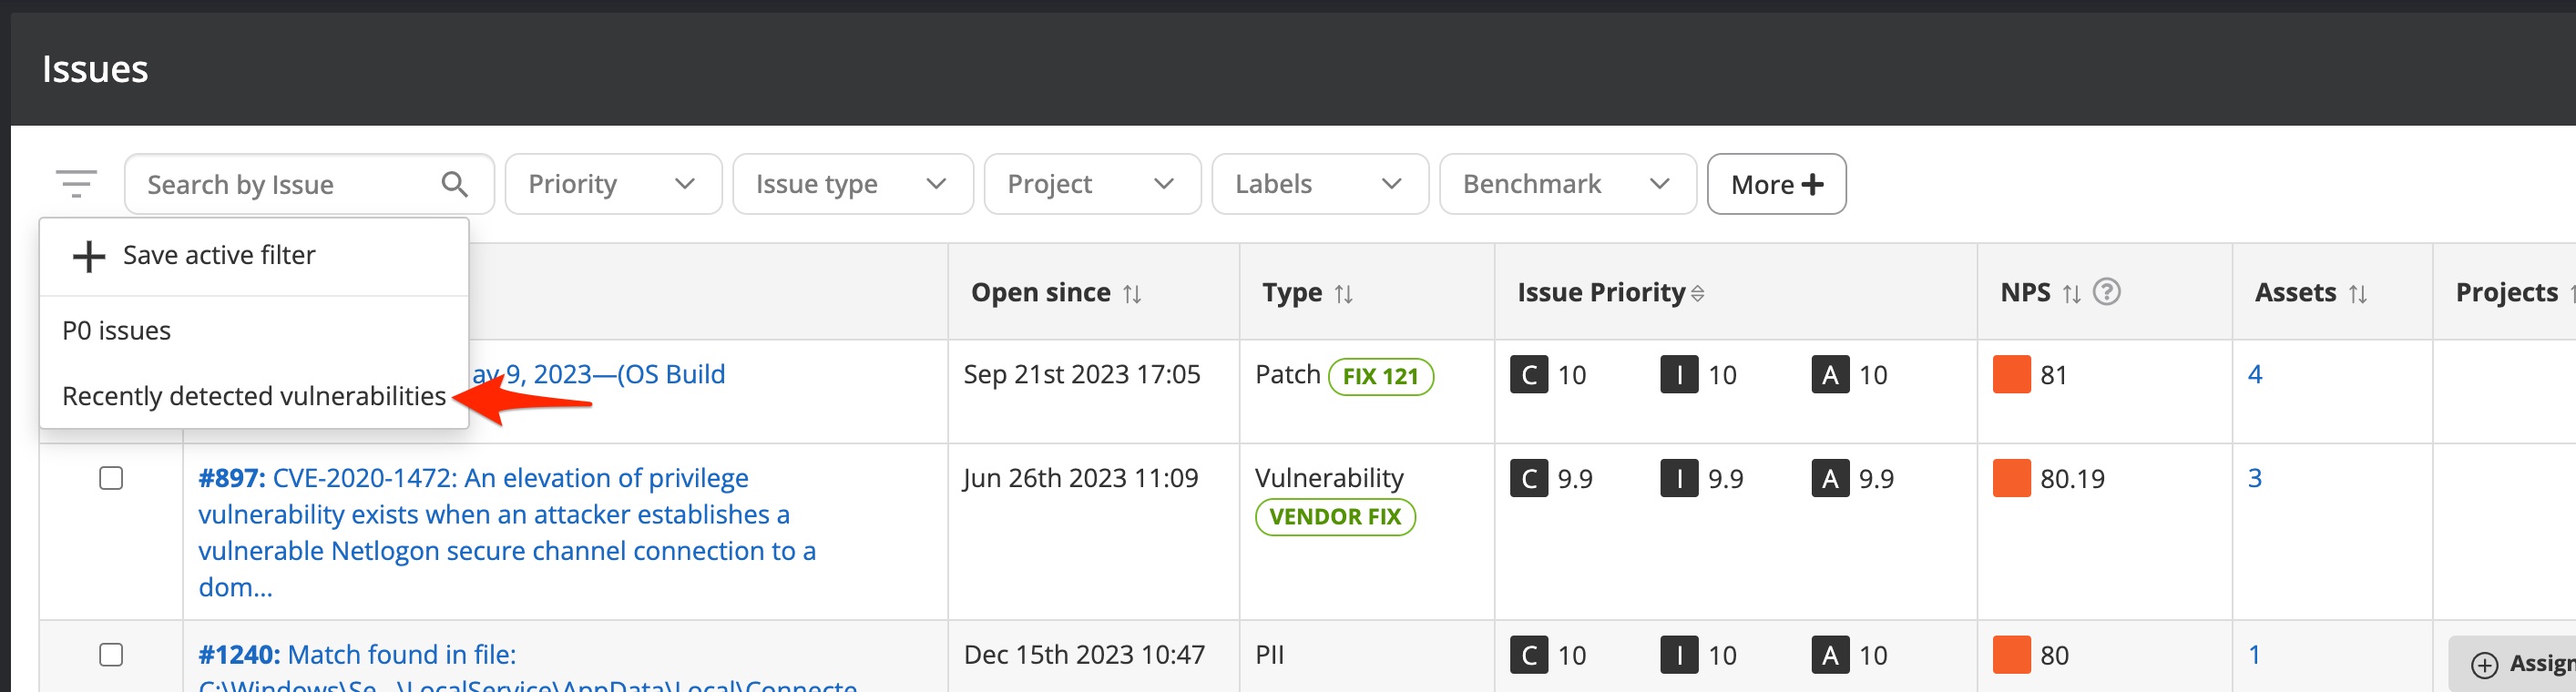
All saved filters can be accessed from the filter menu.
Note
All saved filters are bound to the user. Other users cannot use your saved filters, but can save the same filter for themselves.
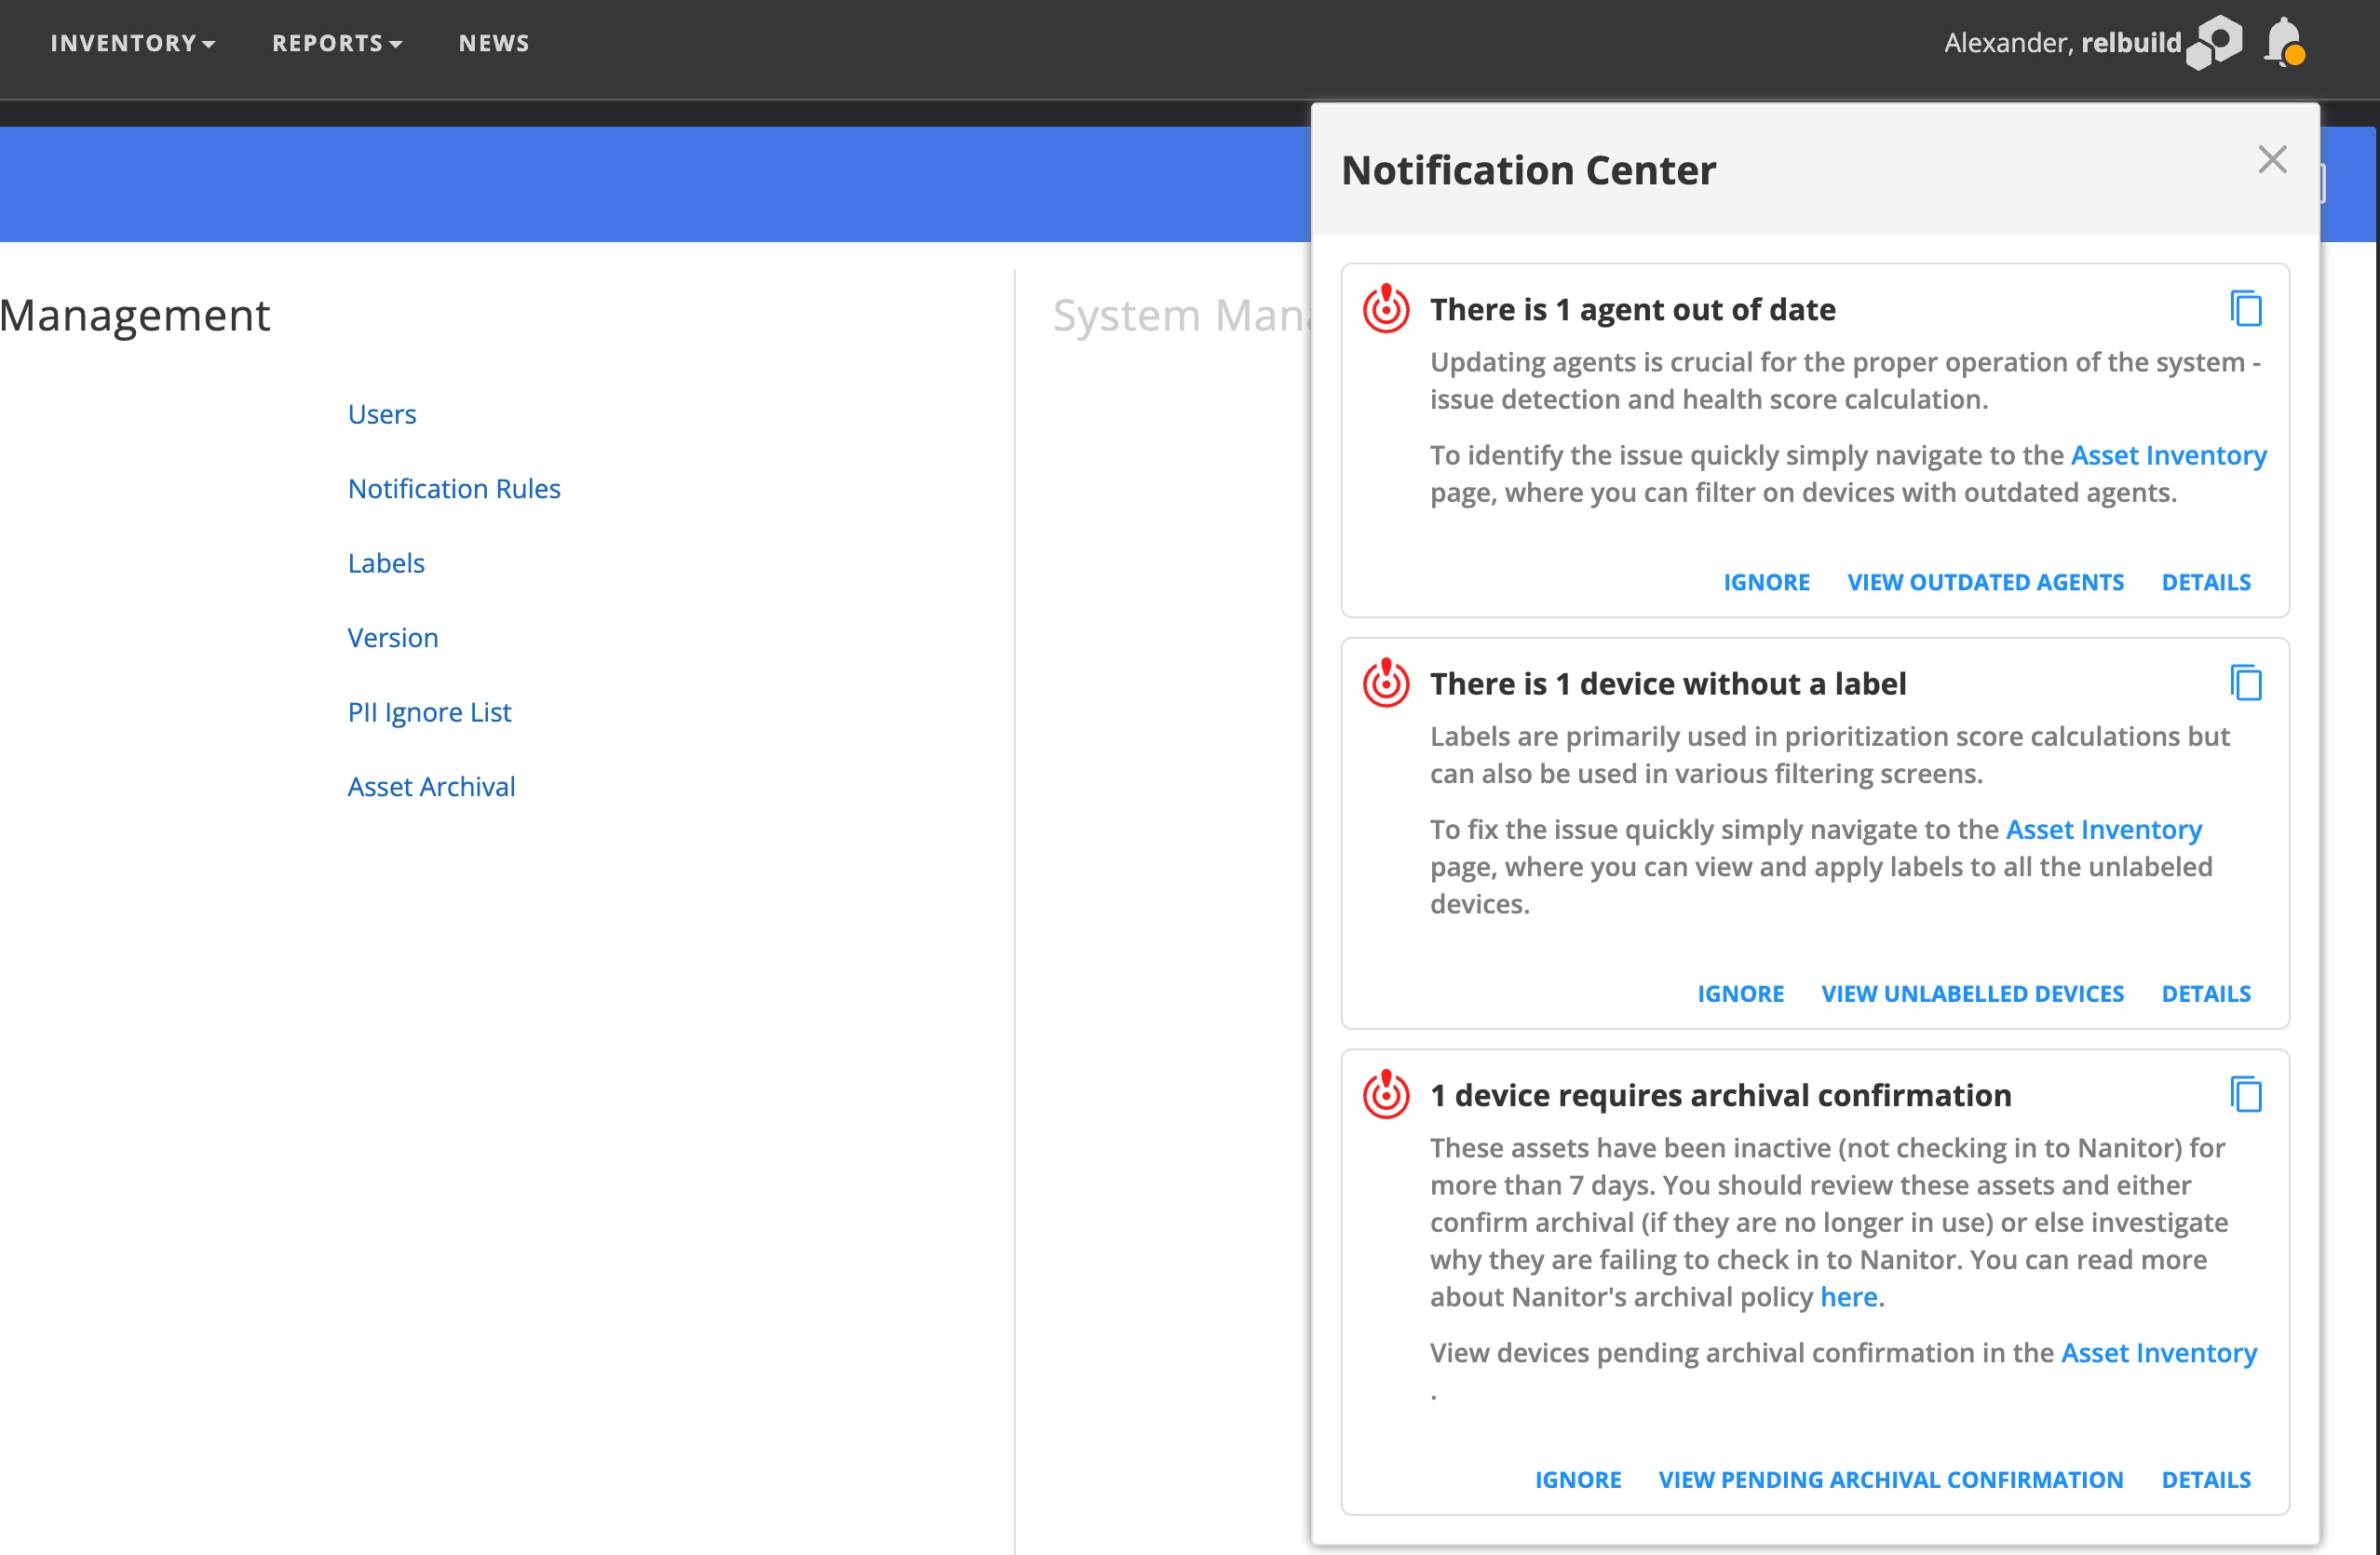
Notification center
The notification center is a helpful tool to point out some detected issues with your setup and/or configuration or can inform you on various topics related to Nanitor (release notes or similar) or on other topics related to cyber security (eg when a newly discovered vulnerability got supported by Nanitor). At the moment only notification messages related to your setup are supported in Nanitor.
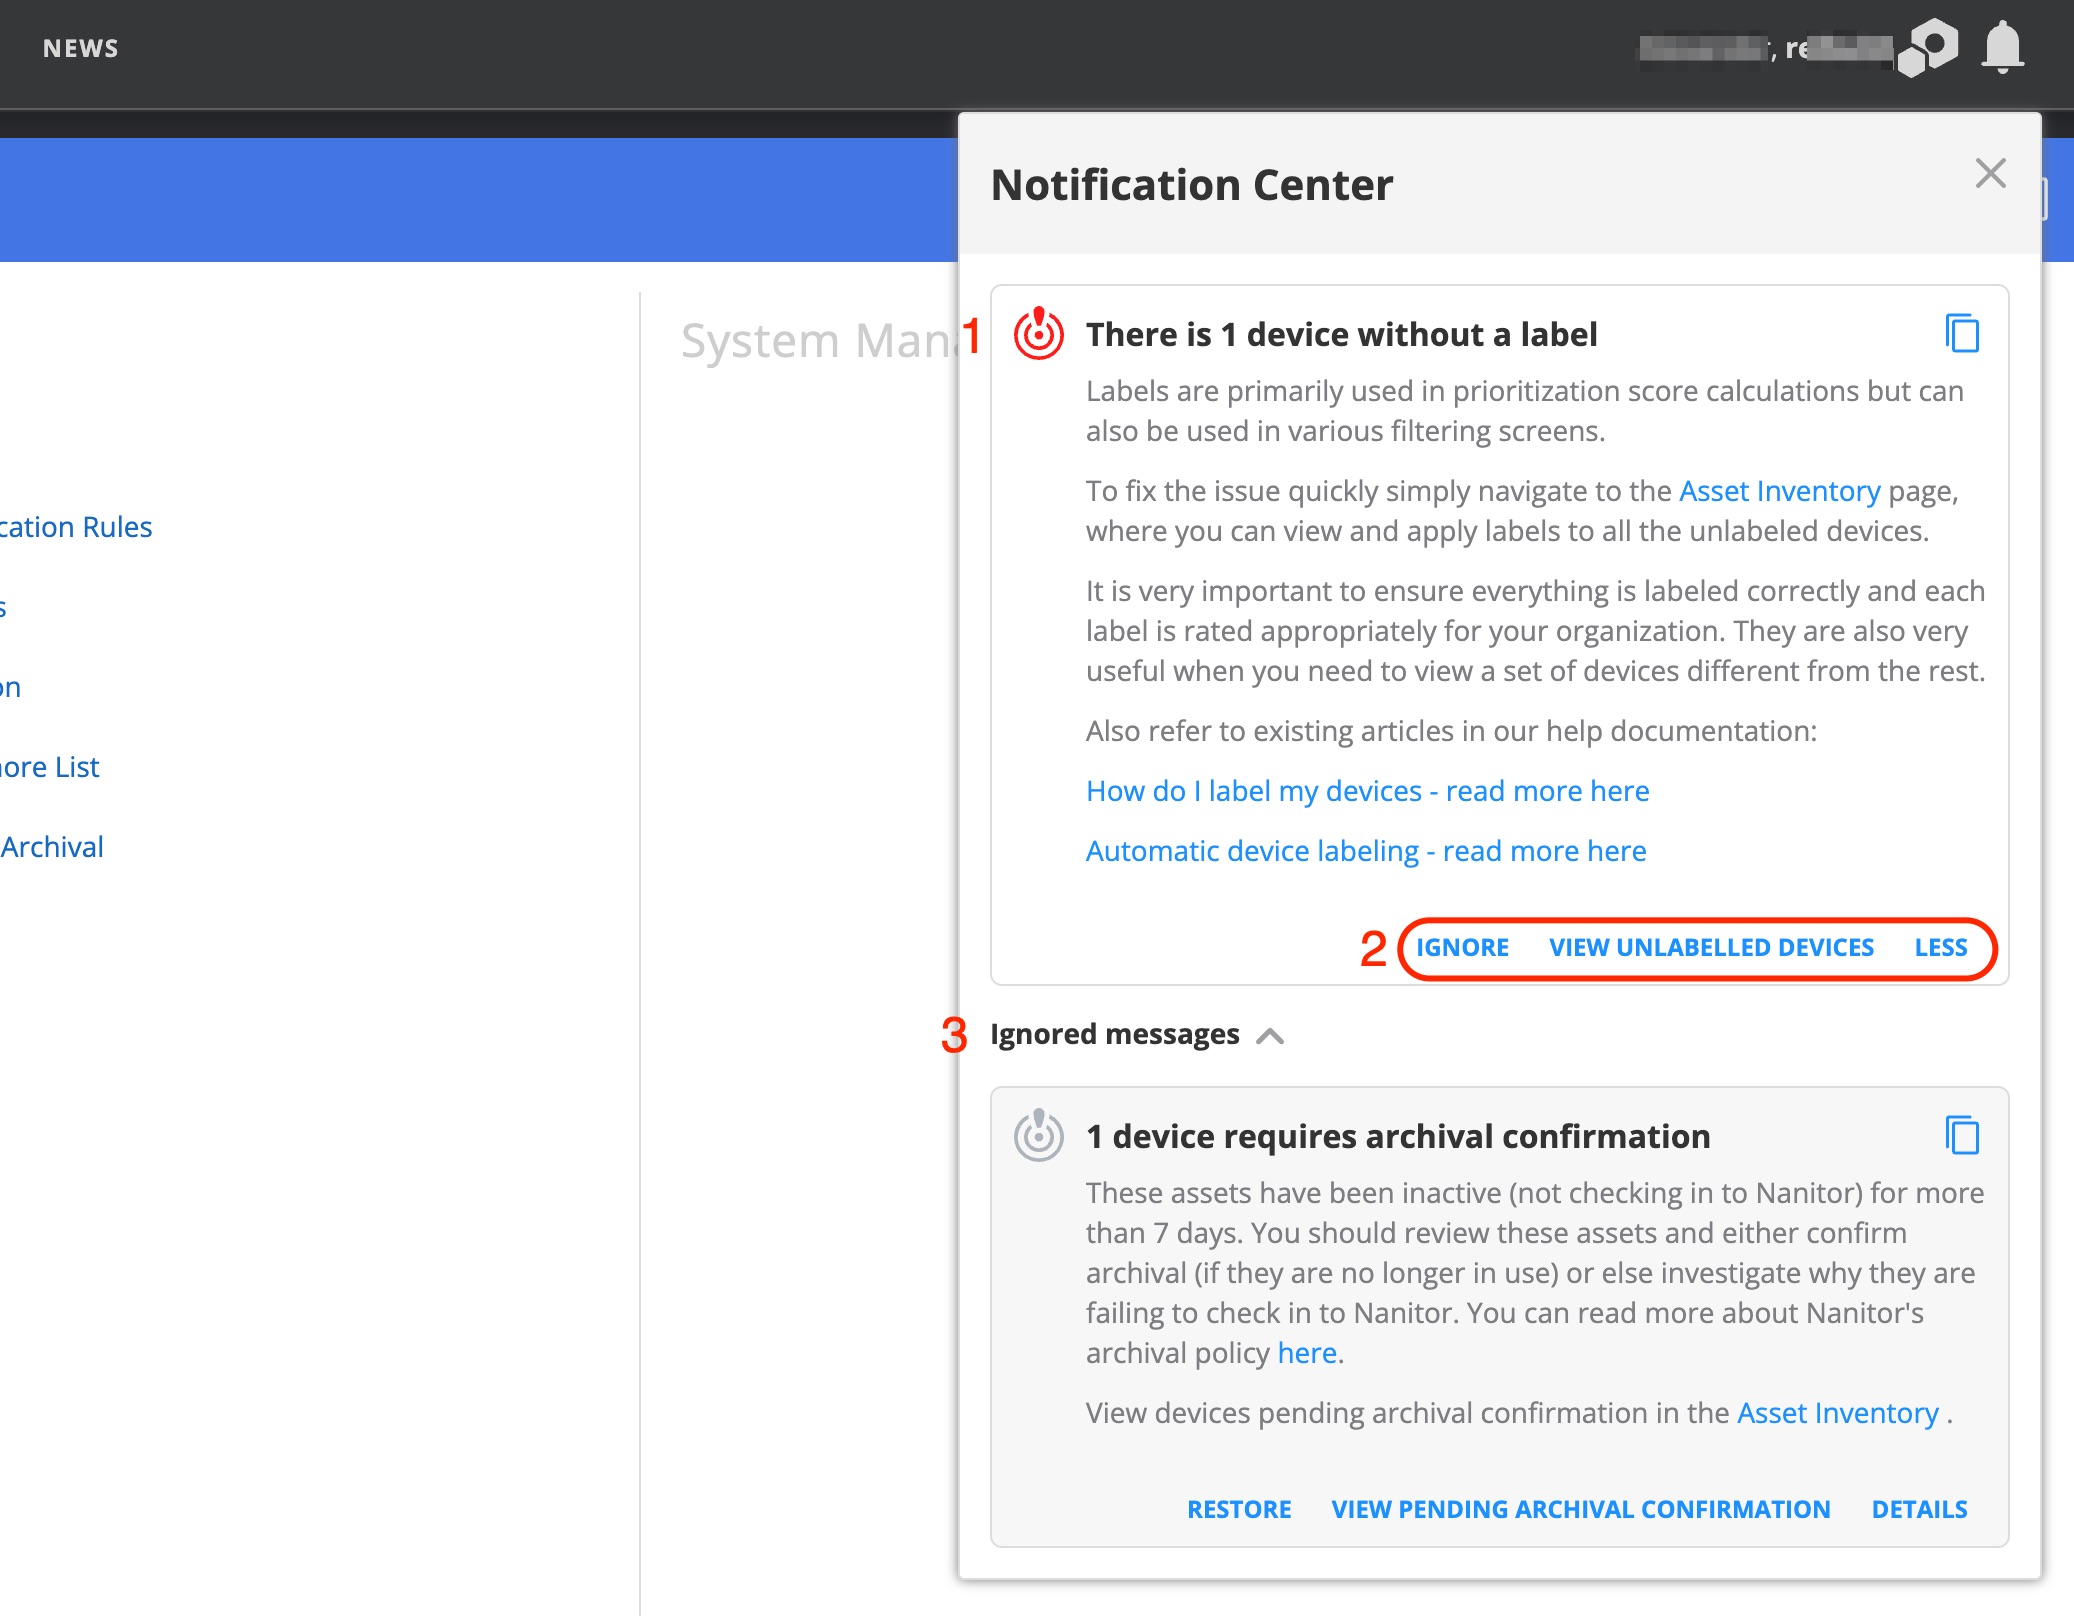
Each notification flagged by Nanitor has a title and a short description. Below each notification, there are several action items available (2). You can:
- Ignore a message. An ignored message will prevent to display of the orange-colored notification icon in the top right corner. Ignores messages will be set in the Ignored section of the notification center (3). An ignored message can be marked to be flagged again by pressing the Restore action button.
- The View .... icon will bring you to a list within Nanitor that shows the problematic area of the notified message. The text of this action button depends on the content of the message it relates to.
- The Details button will reveal more content to the displayed notification. It might include one or more links to help center articles provided by Nanitor. Once the Details button has been pressed it is going to change into a Show less button that will display the default behavior.
Data area
The data area displays information depending on the selected view and the applied filter. The data is usually returned in a table and is usually sorted by a descending priority or in alphabetical order when the prioritization score is not applicable. The sorting can be changed to be applied to other parameters for columns that support sorting. A column that has been set for sorting will be marked in blue (2 in the screenshot below).
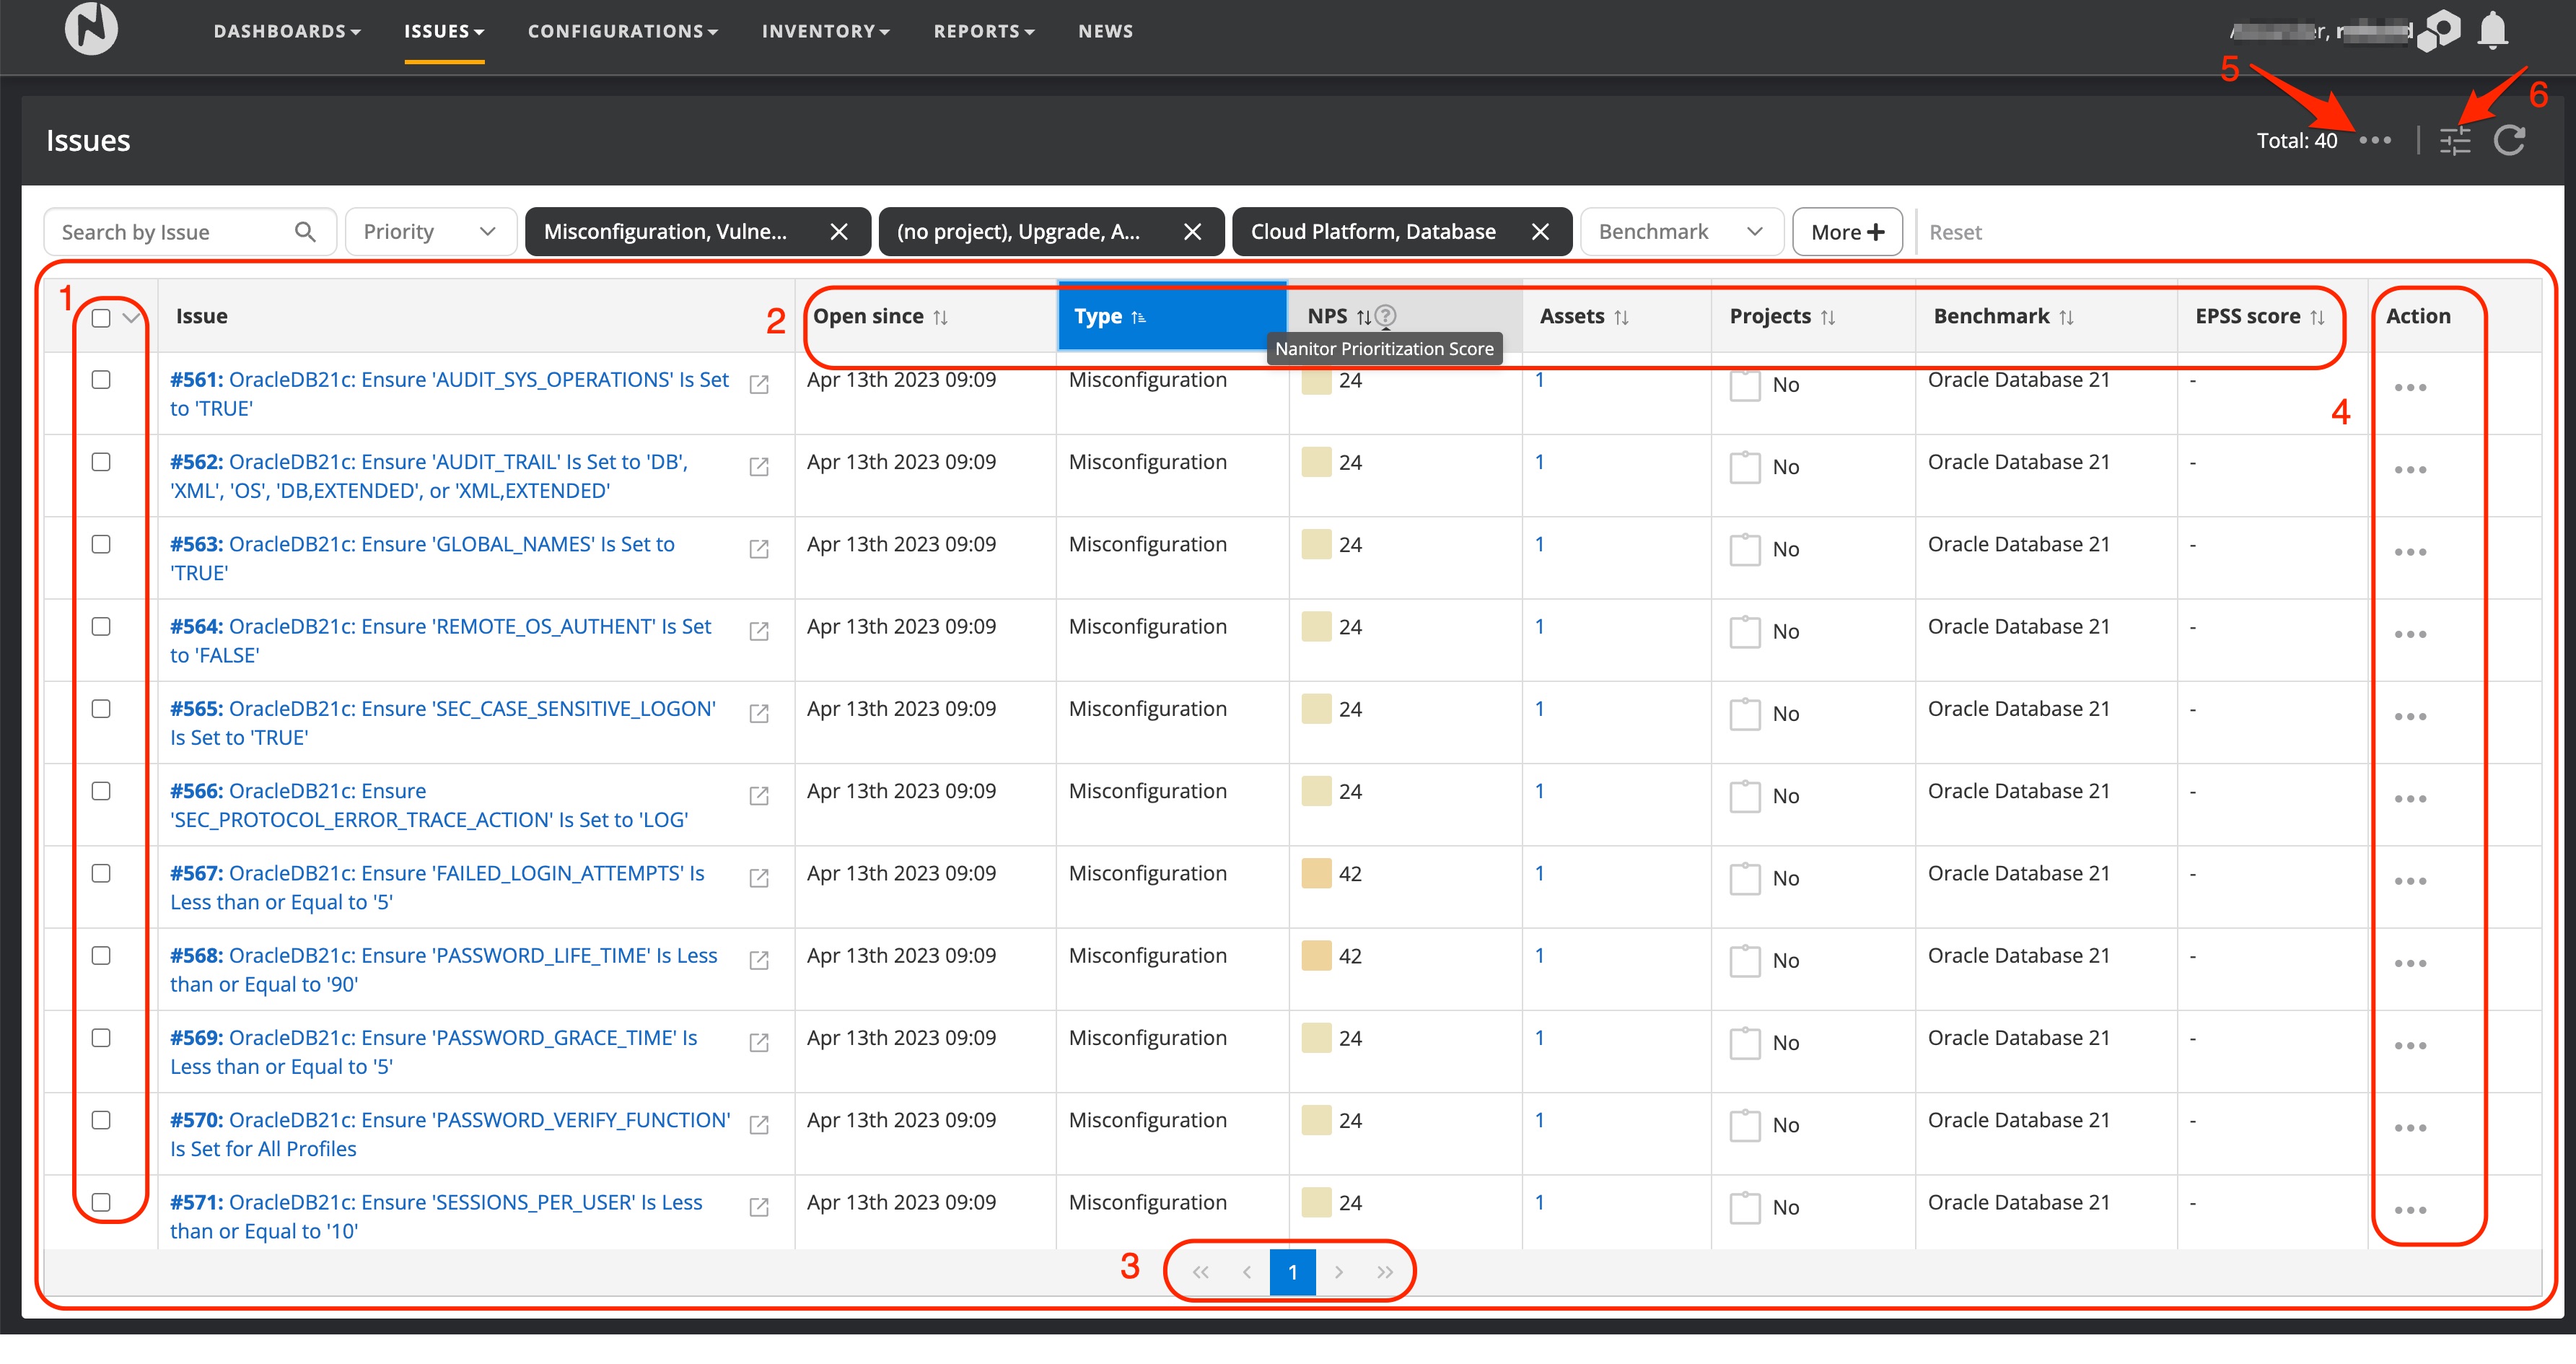
In front of each item in the table view, there is a checkbox that you can tick to apply a multi-select action in conjunction with the action tool menu on the top right (5). The actions available from this section depend on where you are located. In the header row of this column, you can select all records from the paginated page (3). Be aware that the multi-select action will only mark records displayed on the current page. Each displayed page returns 50 items and you can use the navigation arrows from the paging menu (3) to go to the previous or next page based on the applied sorting or jump to the first or last page of the returned data. At the end of each data entry (row), you will find an action menu items that you will activate an action only related to the specific record in the table (4).
On the top right of the data area, you have an additional option to select the visible columns in the data area (6).
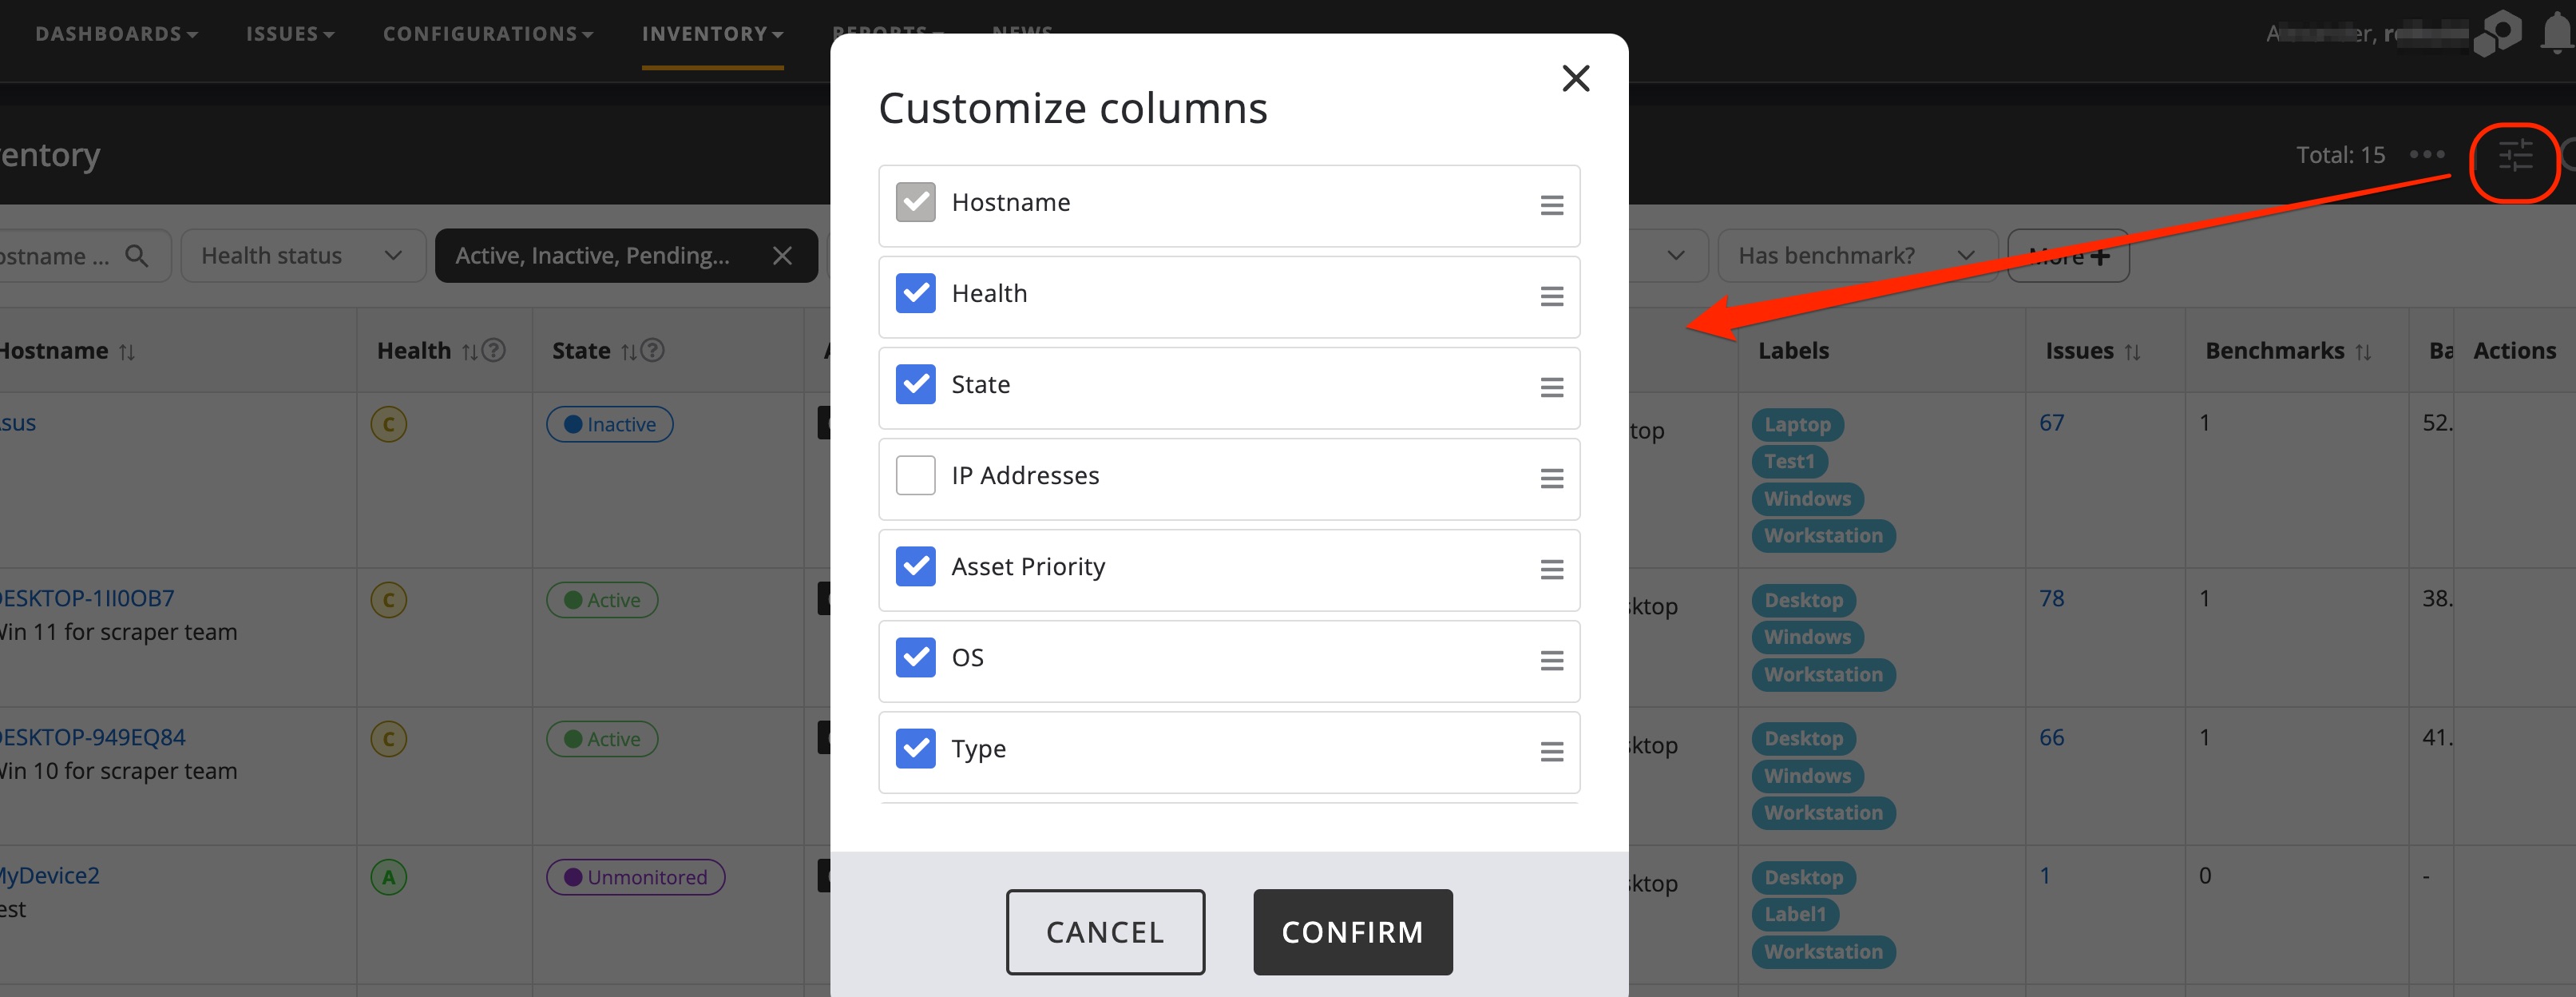
Depending on the data area where you are located you can select the columns that are displayed by checking or unchecking them. Additionally, you can drag and drop the columns to make them display earlier or later in the list of columns.