Issue Trend Metrics Report
The Issue Trend Metrics report provides insights into vulnerability trends over time, helping organizations to track their progress in managing vulnerabilities and improving their security posture. This report is based on reporting data that is stored daily, allowing users to view historical data over time.
The report includes pre-defined filters for device type, device label, and issue type, among others. While it is not possible to customize the report to show trends for a specific asset or group of assets, users can filter the report by device label to see trends for a group of assets.
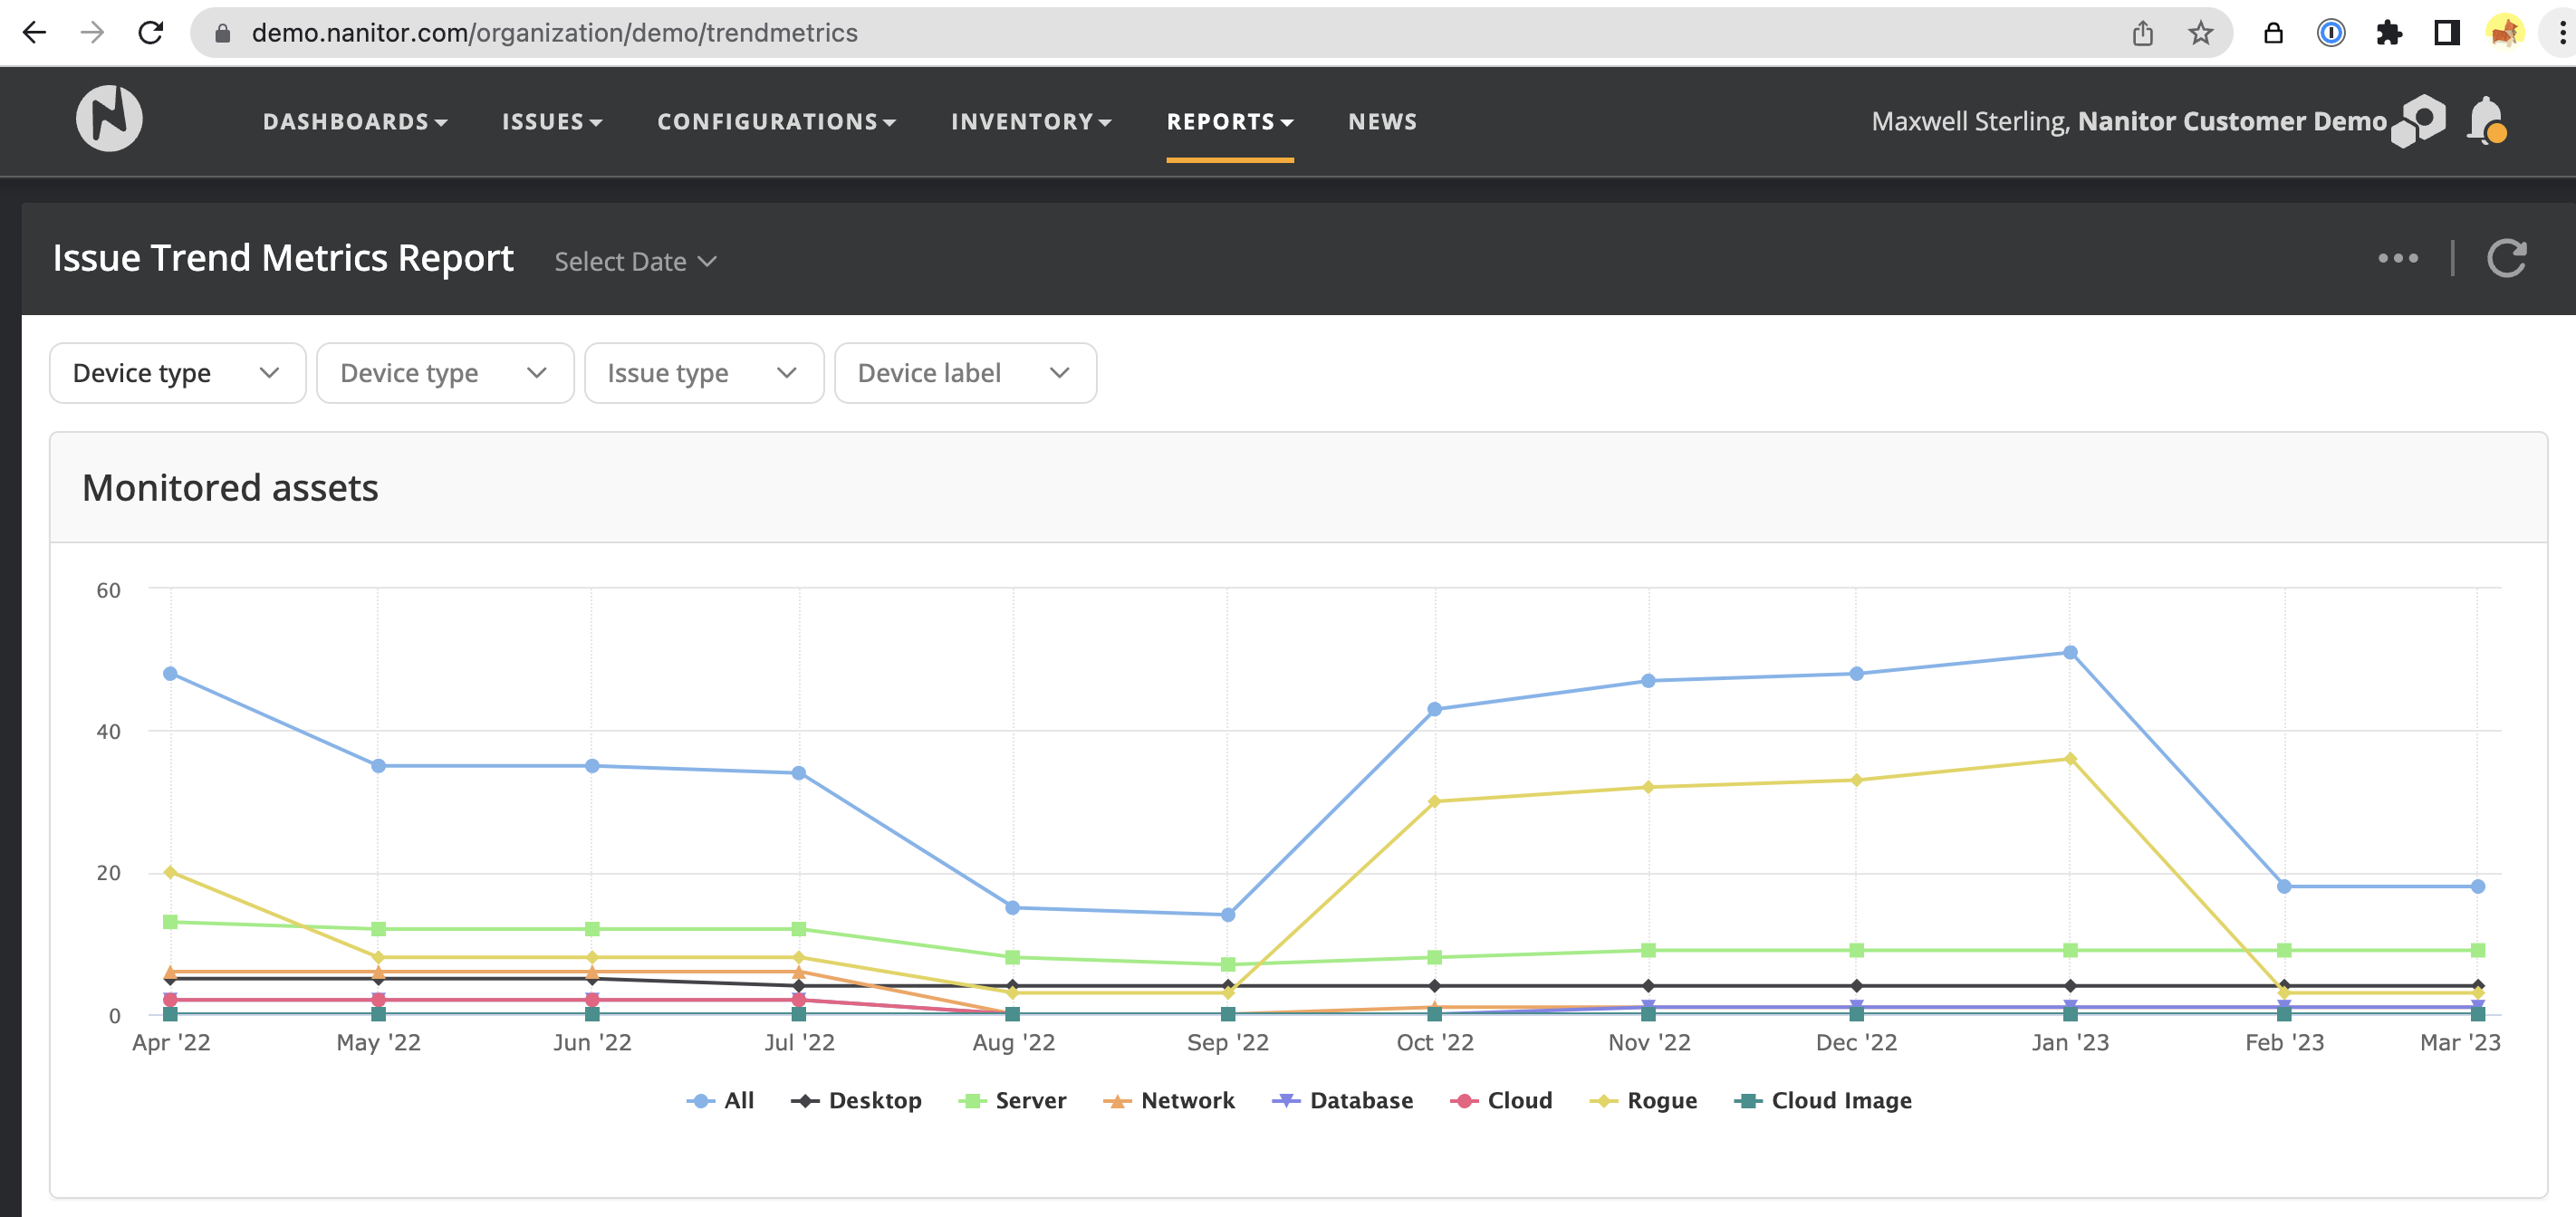
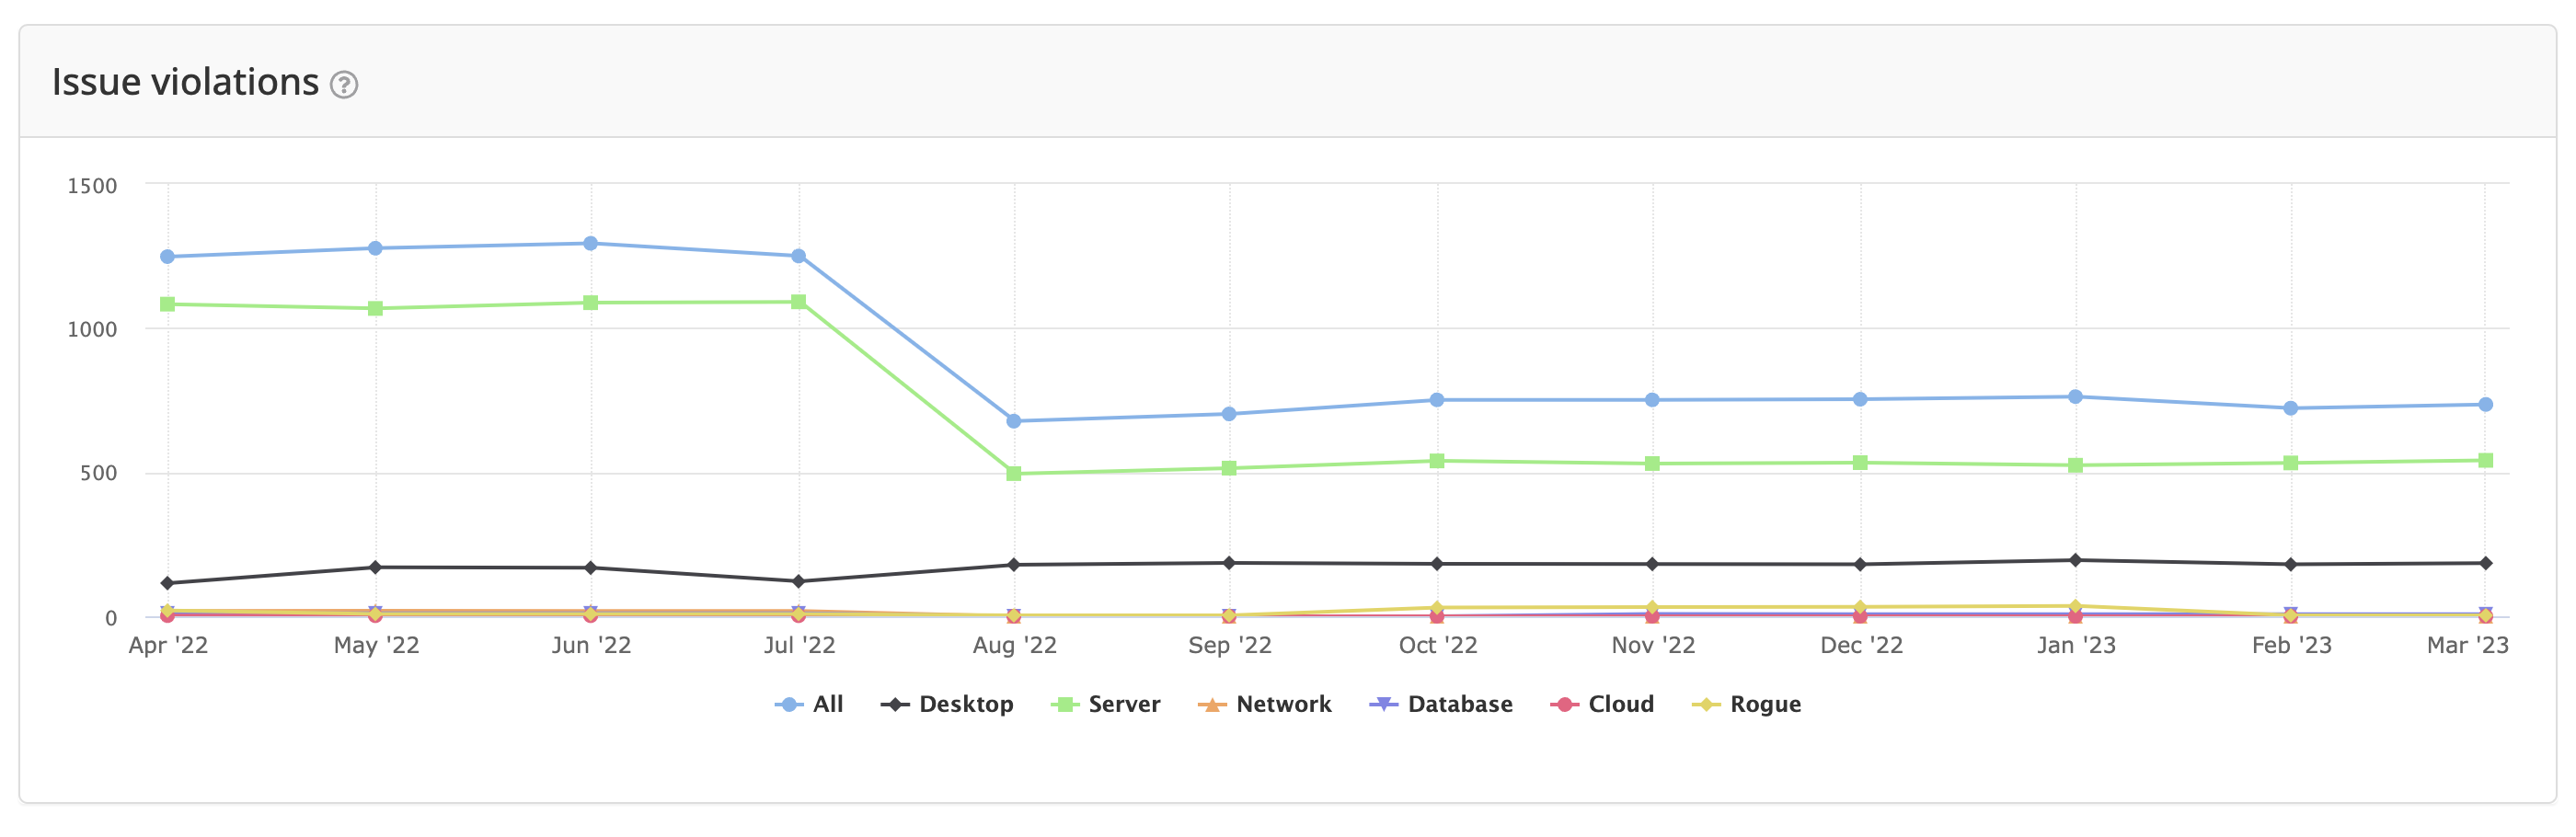
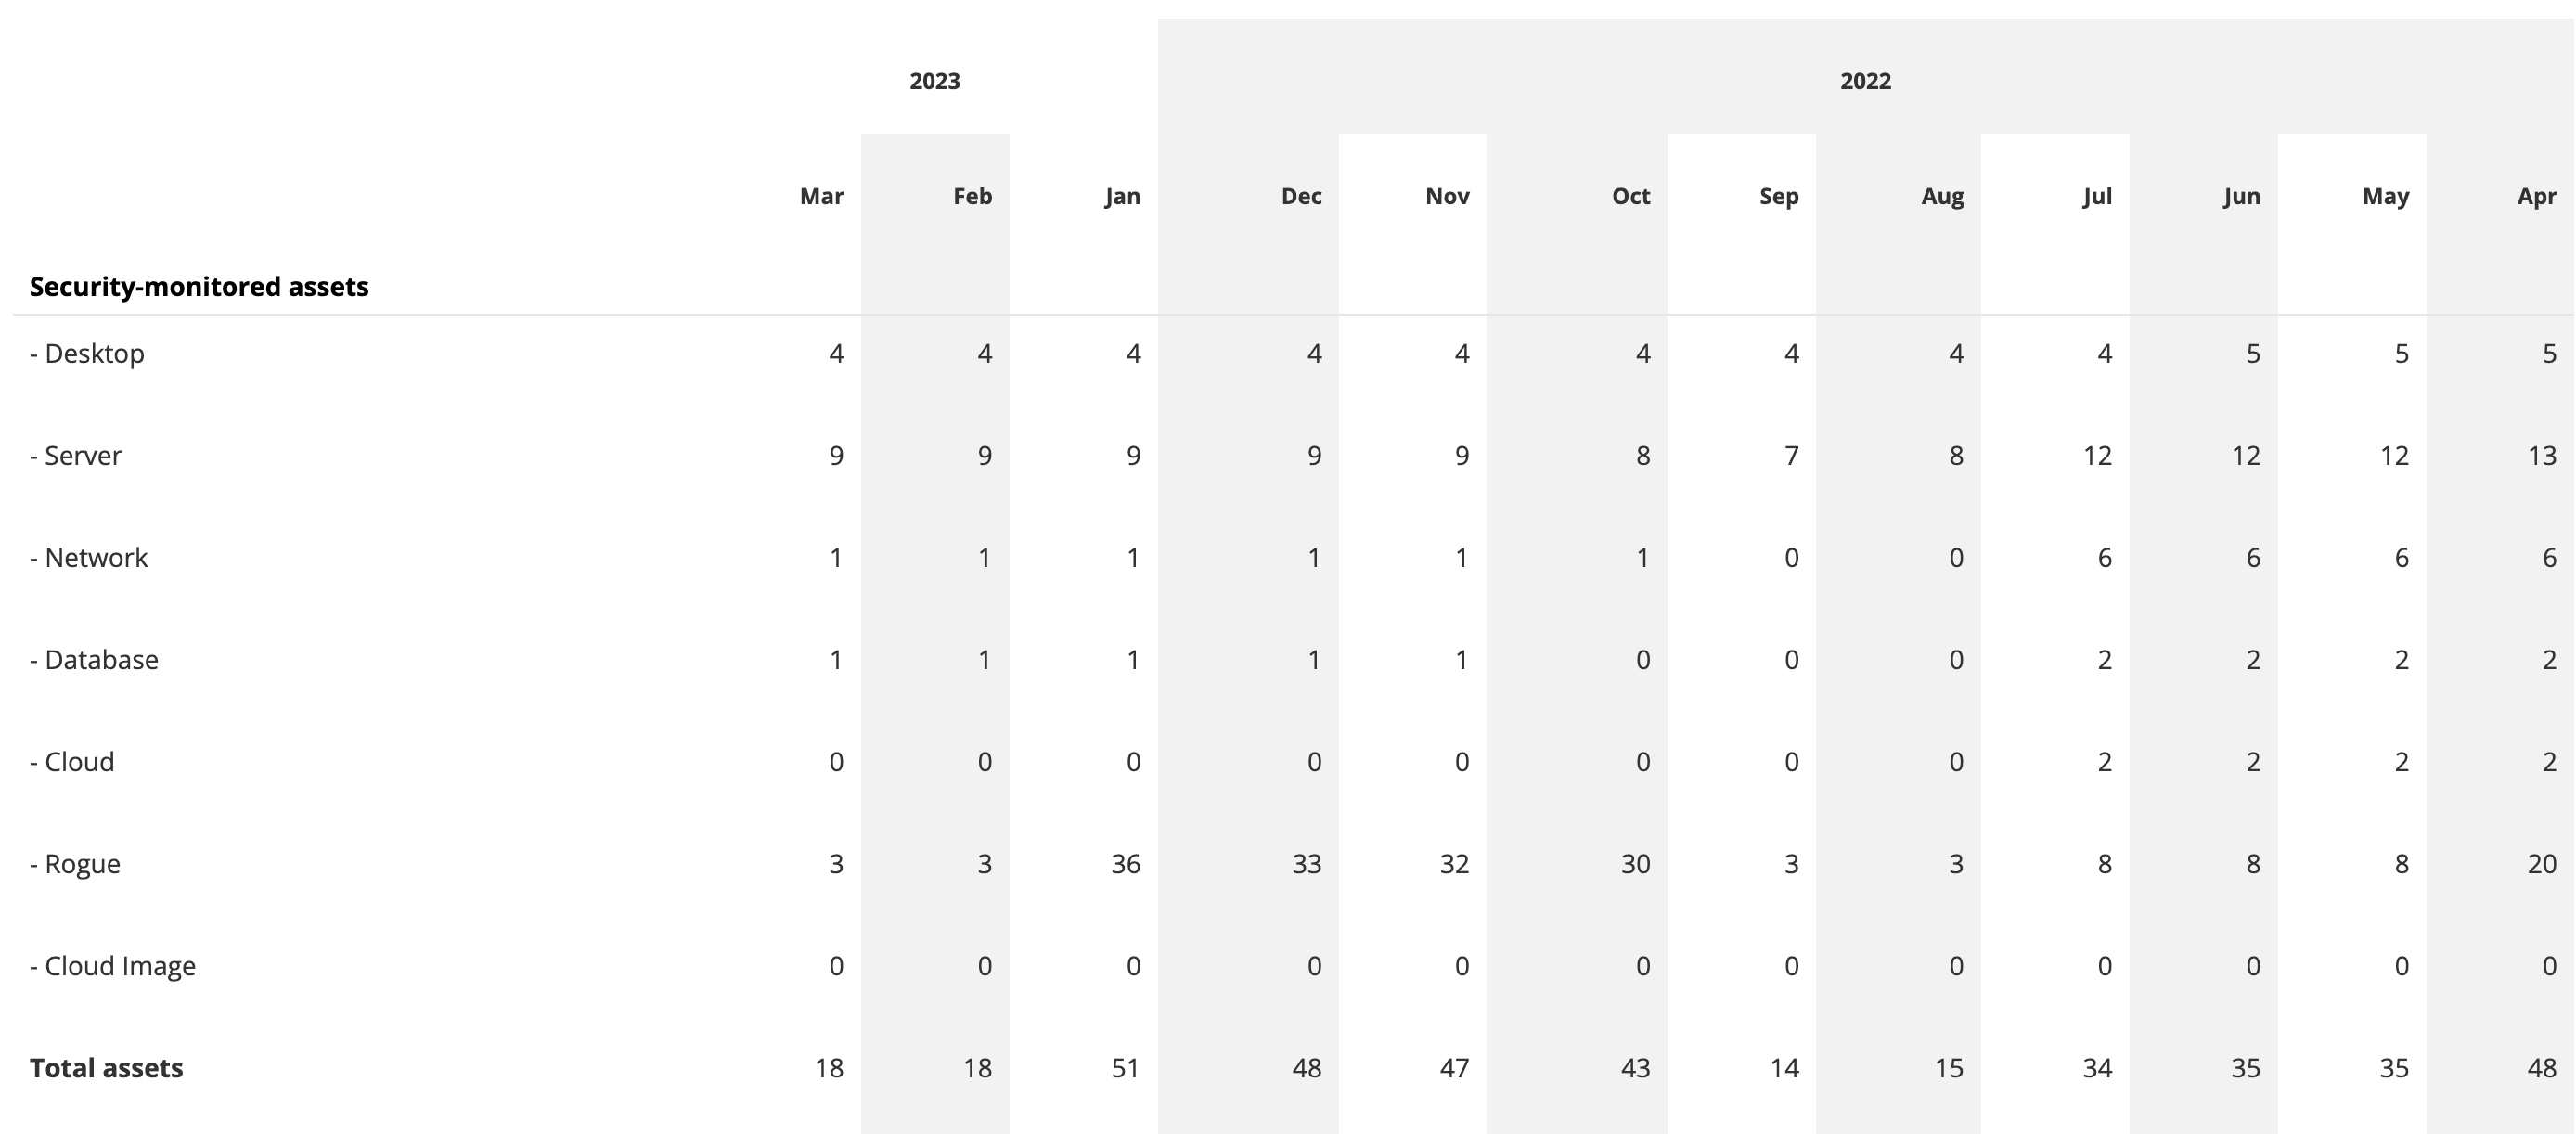
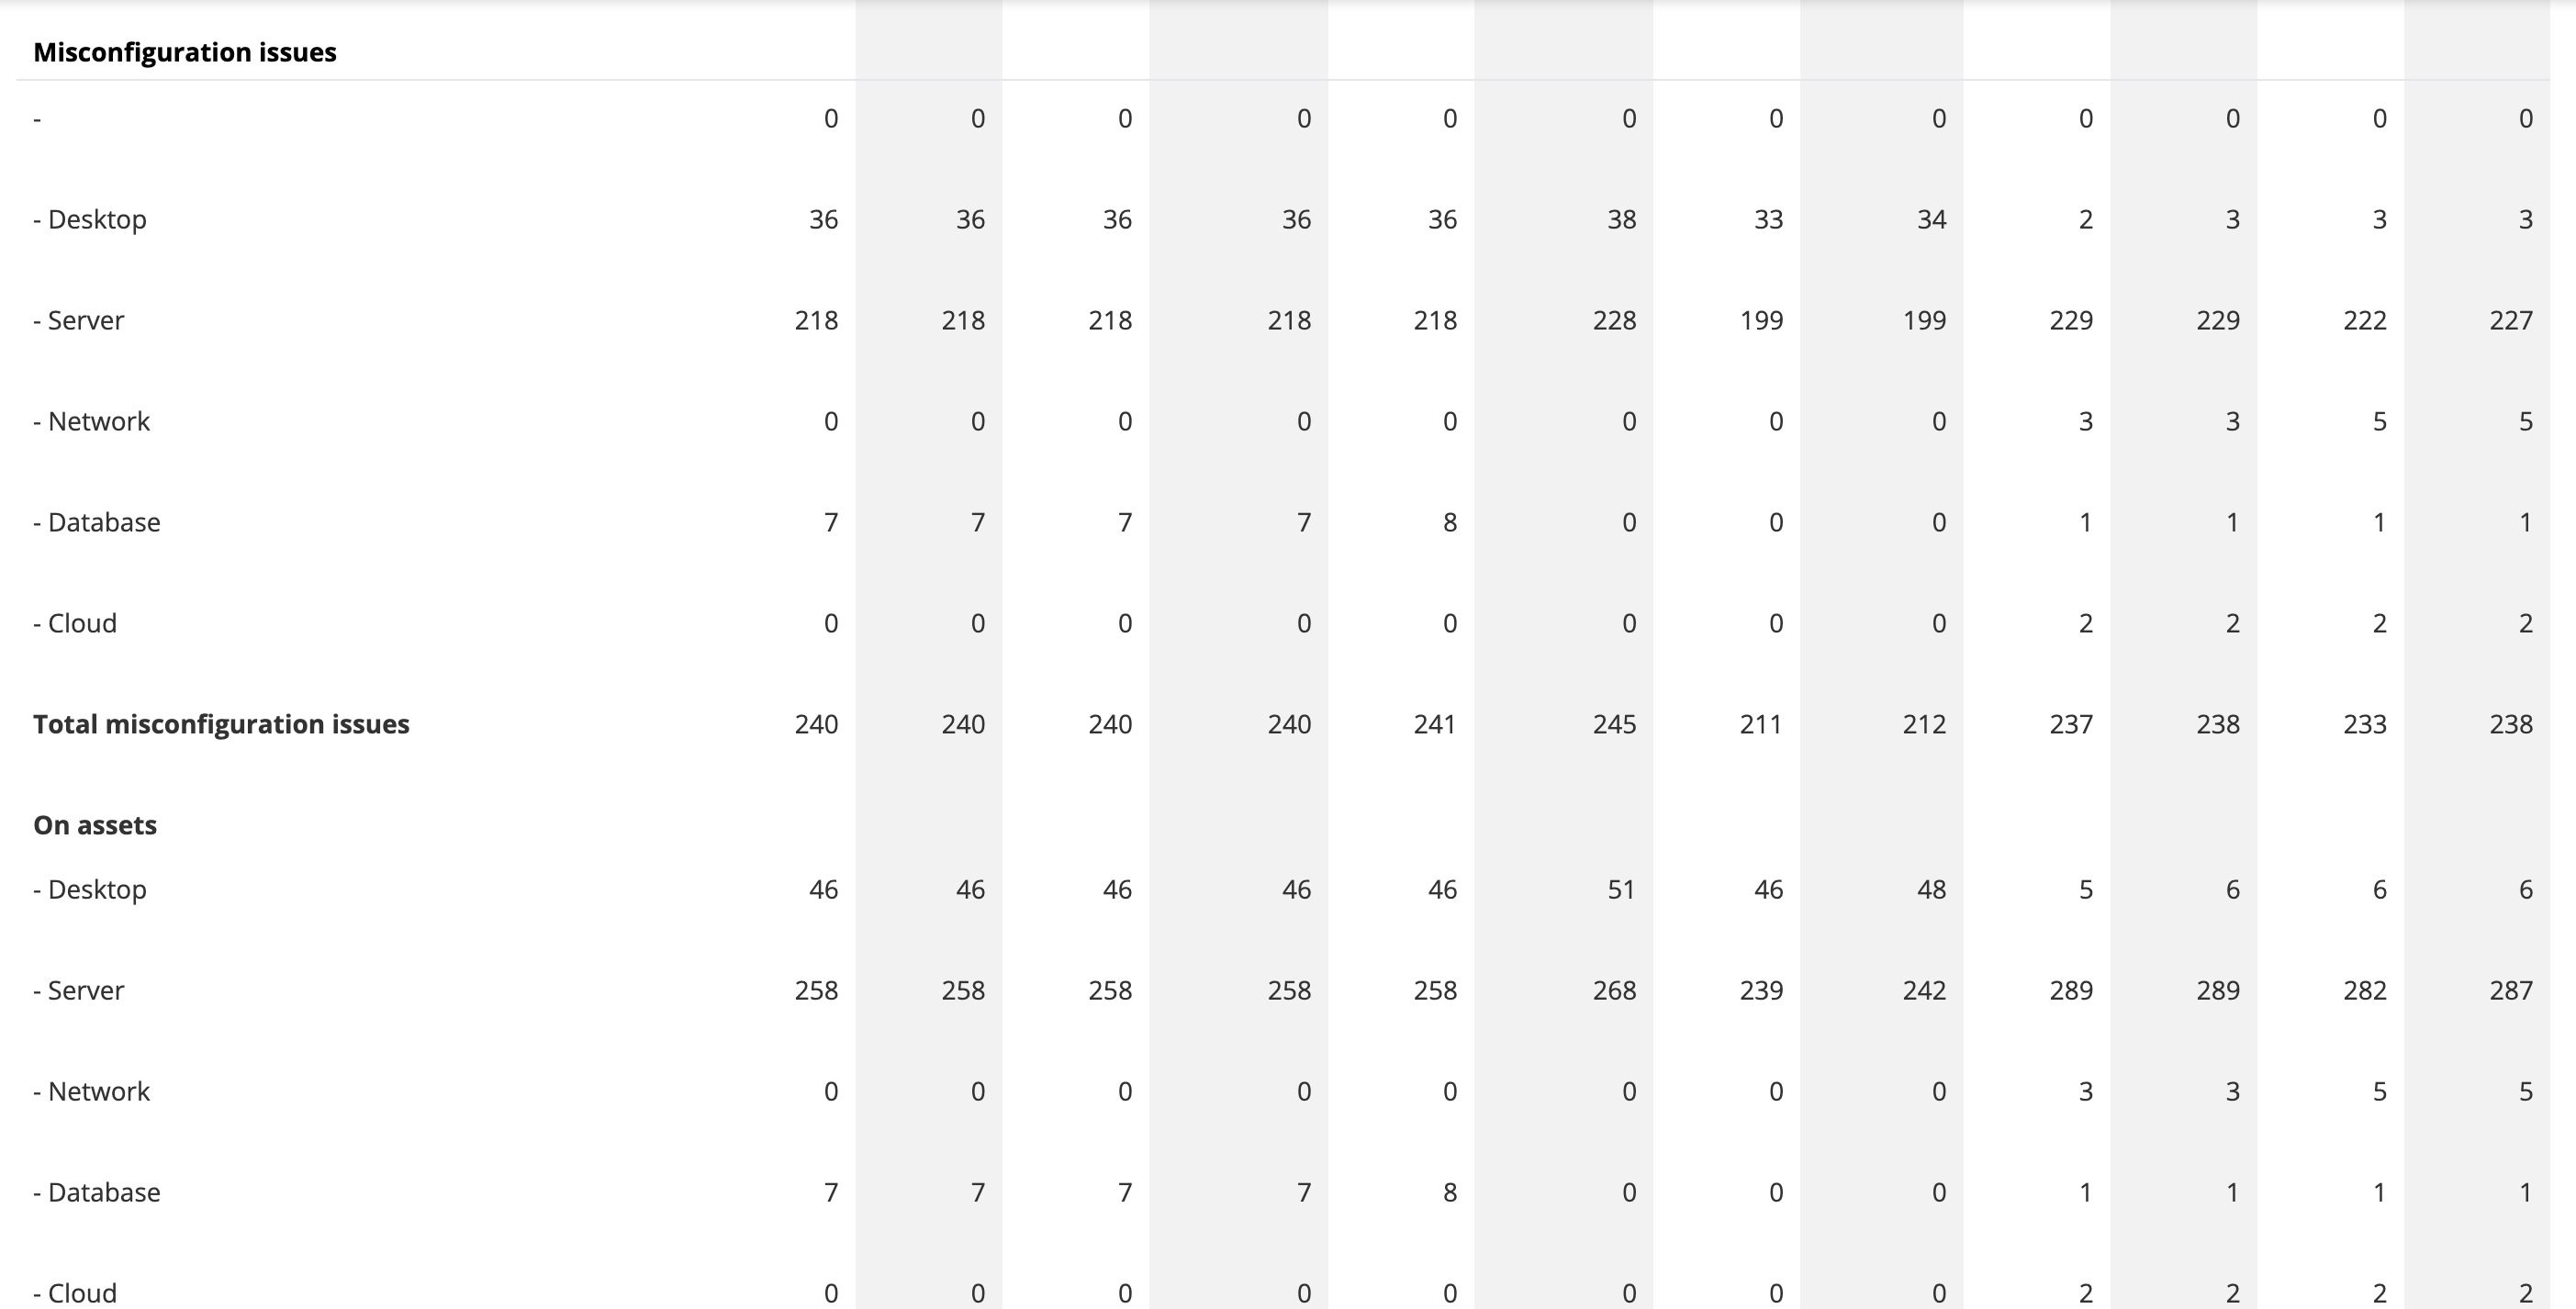
The report provides information on the number of monitored assets and the total number of individual issue violations at each time point, broken down by device type. There are also detailed tables for monitored assets, misconfiguration issues, patch issues, and all other issue types, showing the count and delta from one point to another. The information can be grouped by device label, priority, created reason, and resolved reason, among other criteria, to help identify trends in the system over time.
Overall, the Issue Trend Metrics report is useful for tracking the progress of vulnerability management efforts and identifying areas for improvement. The report can be exported in PDF format, with the ability to define the period and asset label to generate a report based on specific criteria.
The Issue Trend Metrics Report is shown below. It contains the following content:
- Monitored assets graph
- Issue violations graph
- Security-monitored assets table
- Misconfiguration issues table
- Patch issues table
- Vulnerability issues table
- Software issues table
- PII issues table
- User issues table
- Device issues table
- Security checks table
By hovering over the table, one can see how many issues were created or closed from month to month.

where the differential is shown, first the number on the left (green) representing how many were created, and the right number how many were closed (red).
Grouping:
The trends can be grouped by different keys. The options are:
- Device type (default): Breaks the information down by device type.
- Device label: Breaks the information trends down by device label.
- Priority: Breaks the information down by issue prioritization (NPS) groups: P0, P1 and P2.
- Created reason: Breaks the information down by created reason. Can be useful to identify why certain issues might be being created. The created reasons include: Unknown, Change, New issue on device, New issue discovered, New device, Cleanup, Device unarchived, and Technical policy change.
- Resolved reason: Breaks the information down by resolved reason. Can be useful to look into how issues are getting resolved. The resolved reasons include: Change, New device, Cleanup, Device unarchived, Device archived, Rule unassigned, Technical policy change.
Filtering options:
- Device type: Filter on a specific device type or a subset.
- Issue type: Filter on a specific issue type or a subset.
- Device label: Filter on a specific device label or a subset. Can be useful to monitor changes for a given team.
Actions:
- Export: The export action brings up a dialog for exporting the report as a PDF file.
Export options:
The Issue Trend Metrics Report has a PDF export option, where the user can specify a date range and a label.