Global overview dashboard
The Global overview dashboard is the central command center for managing multiple organizations in Nanitor. It is designed for MSPs, MSSPs, and enterprise administrators who oversee several customer or business-unit organizations from a single Nanitor instance.
The dashboard provides a high-level view of the security posture across all organizations you have access to, with key metrics such as issue counts, health scores, assets at risk, and project progress. From here you can quickly identify which organizations need attention, drill into specific issues, and track remediation across your entire portfolio.
Who sees this dashboard?
The Global overview dashboard is available to any user with access to more than one organization. The data shown is automatically scoped to the organizations the user is authorized to view, based on their role and permissions.
You can customize the dashboard by rearranging widgets, choosing which widgets to display, and adjusting the number of columns in the layout.
Built-in widgets
The following widgets are available on the Global overview dashboard:
- Diamond overview: Displays the Issue diamond for all organizations. The issue details grid shows the NPS (Nanitor Prioritization Score), issue description, type, and the organization to which it belongs. Click an issue description to view its details.
- General overview: Shows each organization with its total number of assets, health grade (based on health score), and the number of P0 issues detected.
- Top organizations at risk: Displays the 50 organizations with the lowest health score (or all organizations if fewer than 50). Organizations with the worst health score appear first.
- Issue overview: Shows the number of issues with P0, P1, and P2 priority for each organization.
- Top assets at risk: Displays the 50 assets with the lowest health score across all organizations.
- Projects: Shows projects that are in progress across all organizations.
- Assets search: Allows entering an asset hostname or FQDN to locate the asset within any organization and get information about its health.
Issue Tracker widgets
Issue Tracker widgets let you pin your saved issue filters directly onto the Global dashboard as live monitoring cards. This is useful for tracking specific concerns — such as a critical CVE, a compliance gap, or a category of vulnerabilities — across all your organizations at a glance.
Each widget is tied to one of your saved Issue List filters and updates automatically. You can add multiple Issue Tracker widgets to build a customized view of your security landscape.
Adding an Issue Tracker widget
- On the Global overview dashboard, click the + Add widget button in the Widgets panel header.
- In the Add Tracker dialog, configure the widget:
- Type: Issue Tracker (default).
- Saved filter: Select one of your saved Issue List filters. The dropdown shows each filter's name and scope.
- Mode: Choose Count for a summary view or Breakdown for a per-organization table.
- Click ADD to pin the widget to your dashboard.
![]()
You can add as many Issue Tracker widgets as needed and arrange them freely in the dashboard grid.
Count mode
Count mode provides a compact, high-level summary with three tiles:
- Affected Issues — the number of unique issues matching the filter.
- Affected Organizations — the number of organizations with at least one affected asset. A tooltip shows this count relative to the total number of organizations.
- Affected Assets — the total number of assets across all organizations matching the filter.
Clicking the widget opens the Issue List for the current organization with the saved filter applied.
Breakdown mode
Breakdown mode shows a per-organization table with Issues and Assets columns for each organization in scope. This is useful when you need to see exactly which customer organizations are affected and to what degree.
Use the Hide empty organizations toggle (on by default) to filter out organizations with zero affected assets, keeping the view focused on what matters.
![]()
Removing a widget
To remove an Issue Tracker widget, click the trash icon on the widget card and confirm the removal. This only removes the widget from the dashboard — it does not delete the underlying saved filter.
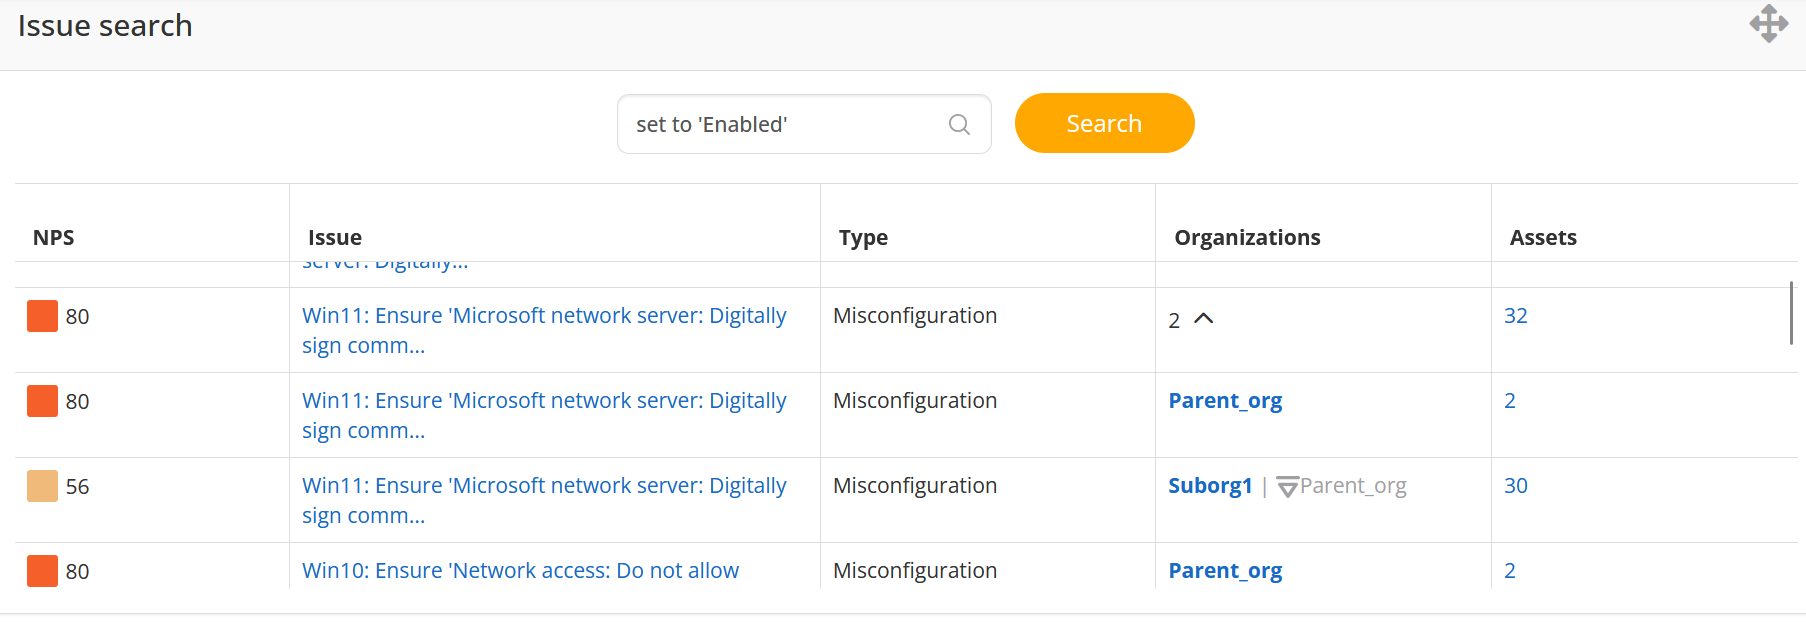
Global issue search
The issue search widget allows you to locate issues across all organizations and see the list of affected assets.
Issues are grouped by their title. Vulnerability, Misconfiguration, and Patch issues with the same name can appear in multiple organizations. Other issue types are more often unique per organization.
Search for issues across all organizations
-
In the Issue search widget, enter the issue title or identifier (for example, a CVE ID) and click Search.
-
The results are displayed as a grid with the following columns:
- NPS: Nanitor Prioritization Score of the issue.
- Issue: The issue title.
- Type: Issue type.
- Organizations: The number of affected organizations (or the organization name if only one is affected).
- Assets: The total number of affected assets.
-
Rows can be expanded to see the list of organizations where the issue is found.
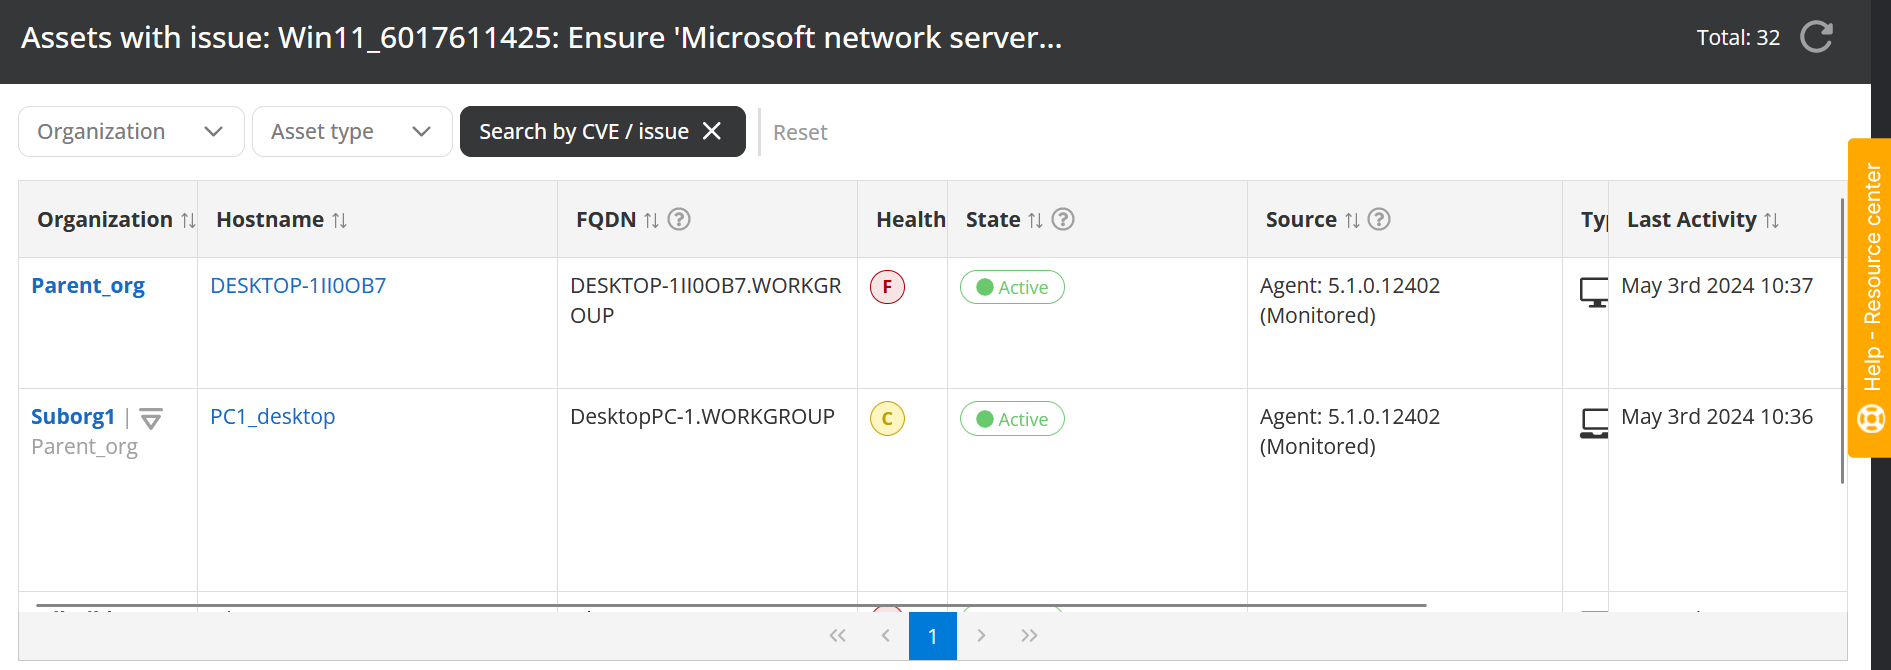
View the list of affected assets across all organizations
-
Click the link in the Assets column for an issue.
-
The Global asset list page opens, showing assets across all affected organizations with the following columns:
- Organization
- Hostname
- FQDN
- Health
- State
- Type
- Labels
- Source
- Last Activity
-
Data in the grid can be filtered by organization and asset type.
-
Click an asset's hostname to view its details.