Asset Details page
The asset detail page is the main profile view of an asset in the Nanitor UI. It shows the entire picture regarding an asset.
The Asset Detail page includes the following information:
-
Asset overview (page header): This includes asset fields such as State, Asset type, etc.; asset health score; asset labels; and asset priority of the asset in terms of Confidentiality (C), Integrity (I), and Availability (A).
-
Asset overview tab: This tab includes information about the asset and its health information.
-
Inventory lists: Tabbed information tables with rich information on the device. More detail about each tab is given below.
Asset overview (page header)
The following information is displayed:
- Asset type: See Asset types for details.
- Asset state: See Asset state for details.
- Information source: See Asset discovery for details. For Agent and Collector information source their version will be displayed.
- OS: The asset OS.
- Health score: See [Asset health score] (/health/#asset-health-score-ahs)
- Labels: See Asset labels for details.
- Asset priority: See [Asset priority] (/prioritization/#static-and-dynamic-priority)
Asset overview tab
The Asset overview tab includes general information about an asset.
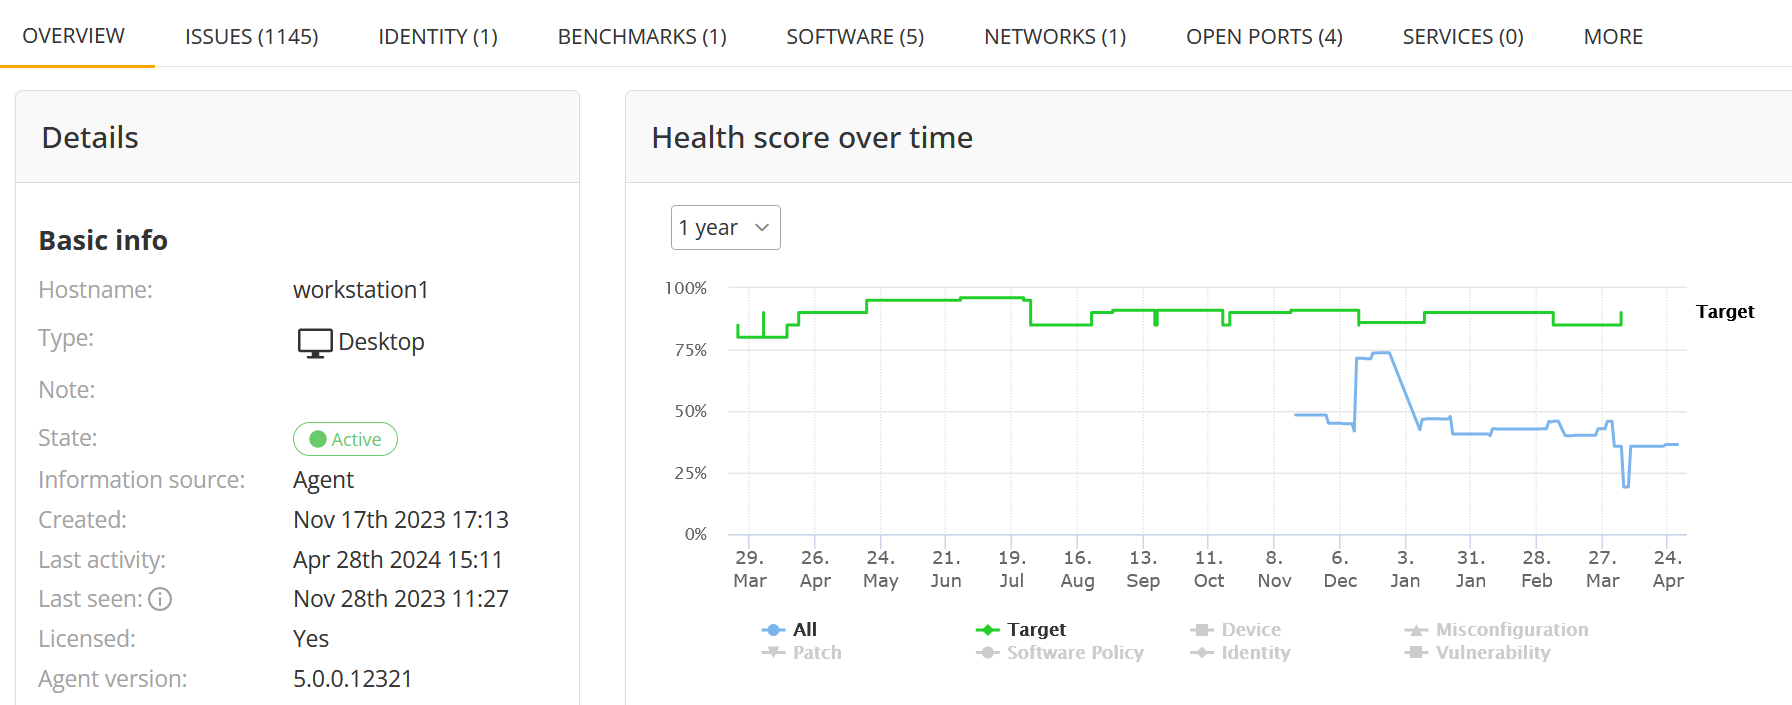
The Asset overview tab includes the following information:
- Details: This section includes Asset basic info (such as asset hostname, FQDN, asset type, device owner, and more), Asset OS details (including the OS, external and internal IPs), Asset labels, Hardware details (such as Manufacturer, Model name, RAM, etc.), Network interfaces, Partitions, and Priority.
- Comments: Comments, if any.
- Health score over time: A linear chart displaying asset health score change over time.
- Health score by issue type: A widget displaying asset health in regards of detected issues.
Asset actions
On the asset detail page, you will find a range of actions available to help you manage the asset, such as applying labels, archiving it, requesting a checkin, requesting the agent's diagnostic logs, viewing supported features, and more. These actions are available either through an available button or the actions menu in the page header
The following table provides a list of the actions available on the asset detail page, along with a brief description of what each action does. Some of the actions are restricted to a certain state or a specific type of device, those restrictions are also listed in the table.
| Action | Description |
|---|---|
| Apply label | Apply a label to this asset. |
| Assign issues | Assign assets issues to a project. |
| Request Recheck | Flags the asset to check in full information next time it is in contact. |
| Confirm archival | Confirms archival of the asset with states "Pending Archival" on all assets with the current filter applying. Note: This does not archive assets unless it has that specific status. |
| Archive asset | Archive the asset manually. |
| Restore asset | Restore a device that was manually archived previously. |
| Create PDF report | Generates a PDF report with information about the asset. |
| Export issues as CSV | Exports inforamation about the assets issues in a list as a CSV file. |
| Authorize asset | Authorize a rogue asset. |
| Unauthorize asset | Revoke the authorization of a rogue asset. |
| Supported features | Opens a dialog displaying what Nanitor features are supported for that device (i.e. misconfiguration checks, patch checks, software inventory, etc.). |
| Probe | Perform a port probe of this asset. |
Authorize asset (rogue assets only)
This action allows an admin user to authorize a rogue asset, moving it from the Rogue state.
When an asset discovers an unmonitored asset on the network, that unmonitored asset is added to Nanitor as a rogue asset by default. However, not all unmonitored assets are necessarily rogue (printers for example).
To prevent legitimate assets from being marked as rogue, admin users can use the Authorize asset action to move a rogue asset to the Unmonitored state. This indicates that the asset has been approved and is now considered a legitimate part of the network. By authorizing the asset, it will not be monitored by the system, but it will still be visible in the system as a legitimate asset.
To do this, the user needs to open up the authorize dialog by selecting Authorize asset from the asset actions list:
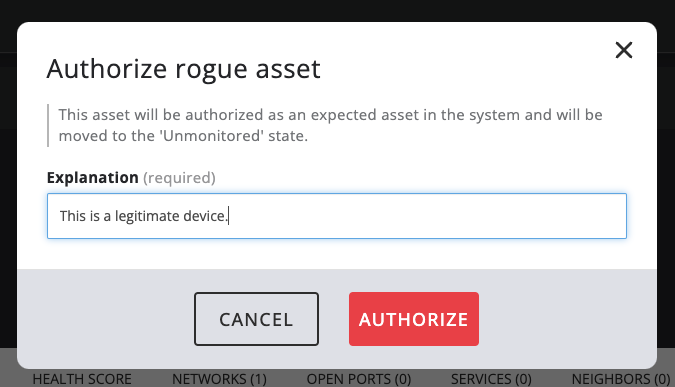
This opens up the authorize dialog:
When authorizing an asset the user is required to provide a reason for the authorization.
This feature allows users to quickly and easily identify and authorize legitimate assets that have been flagged as rogue, reducing the risk of unnecessary security alerts and ensuring that all assets on the network are properly accounted for.
Unauthorize asset (authorized rogue assets only)
This action allows an admin user to revoke the authorization of a rogue asset, the opposite of authorizing it.
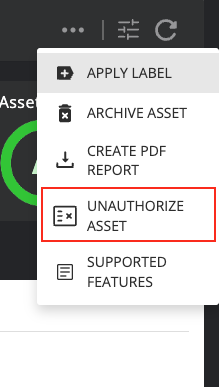
To do this, the user needs to open up the unauthorize dialog by selecting Unauthorize asset from the asset actions list:
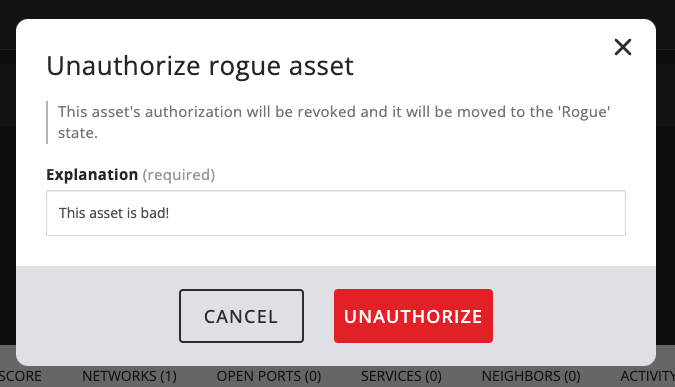
This opens up the unauthorize dialog:
When unauthorizing an asset the user is required to provide a reason for the authorization to be revoked.
Probe asset (rogue assets only)
When rogue assets are found on the network, it can be difficult to tell which device is which and whether they are known assets on the network or unknown devices that could be malicious. To help identify rogue assets, Nanitor offers port probing and SNMP probing.
The Probe action is available for a rogue asset if port probing has been enabled by an organization admin (Settings -> General -> Network Discovery), allowing the user to probe it for more information. Port probing involves attempting to connect to various well-known ports on the asset to identify whether common services are running, giving a better idea of what the asset is. If SNMP probing is also enabled, the probe will also fetch information on the asset's make and manufacturer through the Simple Network Management Protocol.
So long as port probing has been enabled for the organization, any Nanitor user can initiate a probe of an unauthorized rogue asset. Probing can be performed using the Actions menu for a certain asset in the asset list:
When viewing the details of an unauthorized rogue device, a probe can be initiated either from a link in the "Description" panel or from the action menu:
Clicking the probe action will bring up a confirmation dialog. Always be sure to have permission from the IT department to initiate a network probe on an asset, as the generated traffic may be disruptive or detected as suspicious by monitoring tools.
Once a probe has been initiated, one of the asset's neighbors (other devices that have detected it on their network) will be chosen to perform the probe. When that asset checks in and is told to probe, the Nanitor Agent on that machine will attempt to connect to various ports on the target asset and report the results back to the Nanitor Server.
If SNMP probing has been enabled, the probe will also attempt to collect some further information about the asset using SNMP v1 and v2, if available. This might include information such as a system name and description, which can be particularly helpful for identifying the asset. Once results have been reported back to the server, they will be shown in the asset detail, below the "Description" panel:
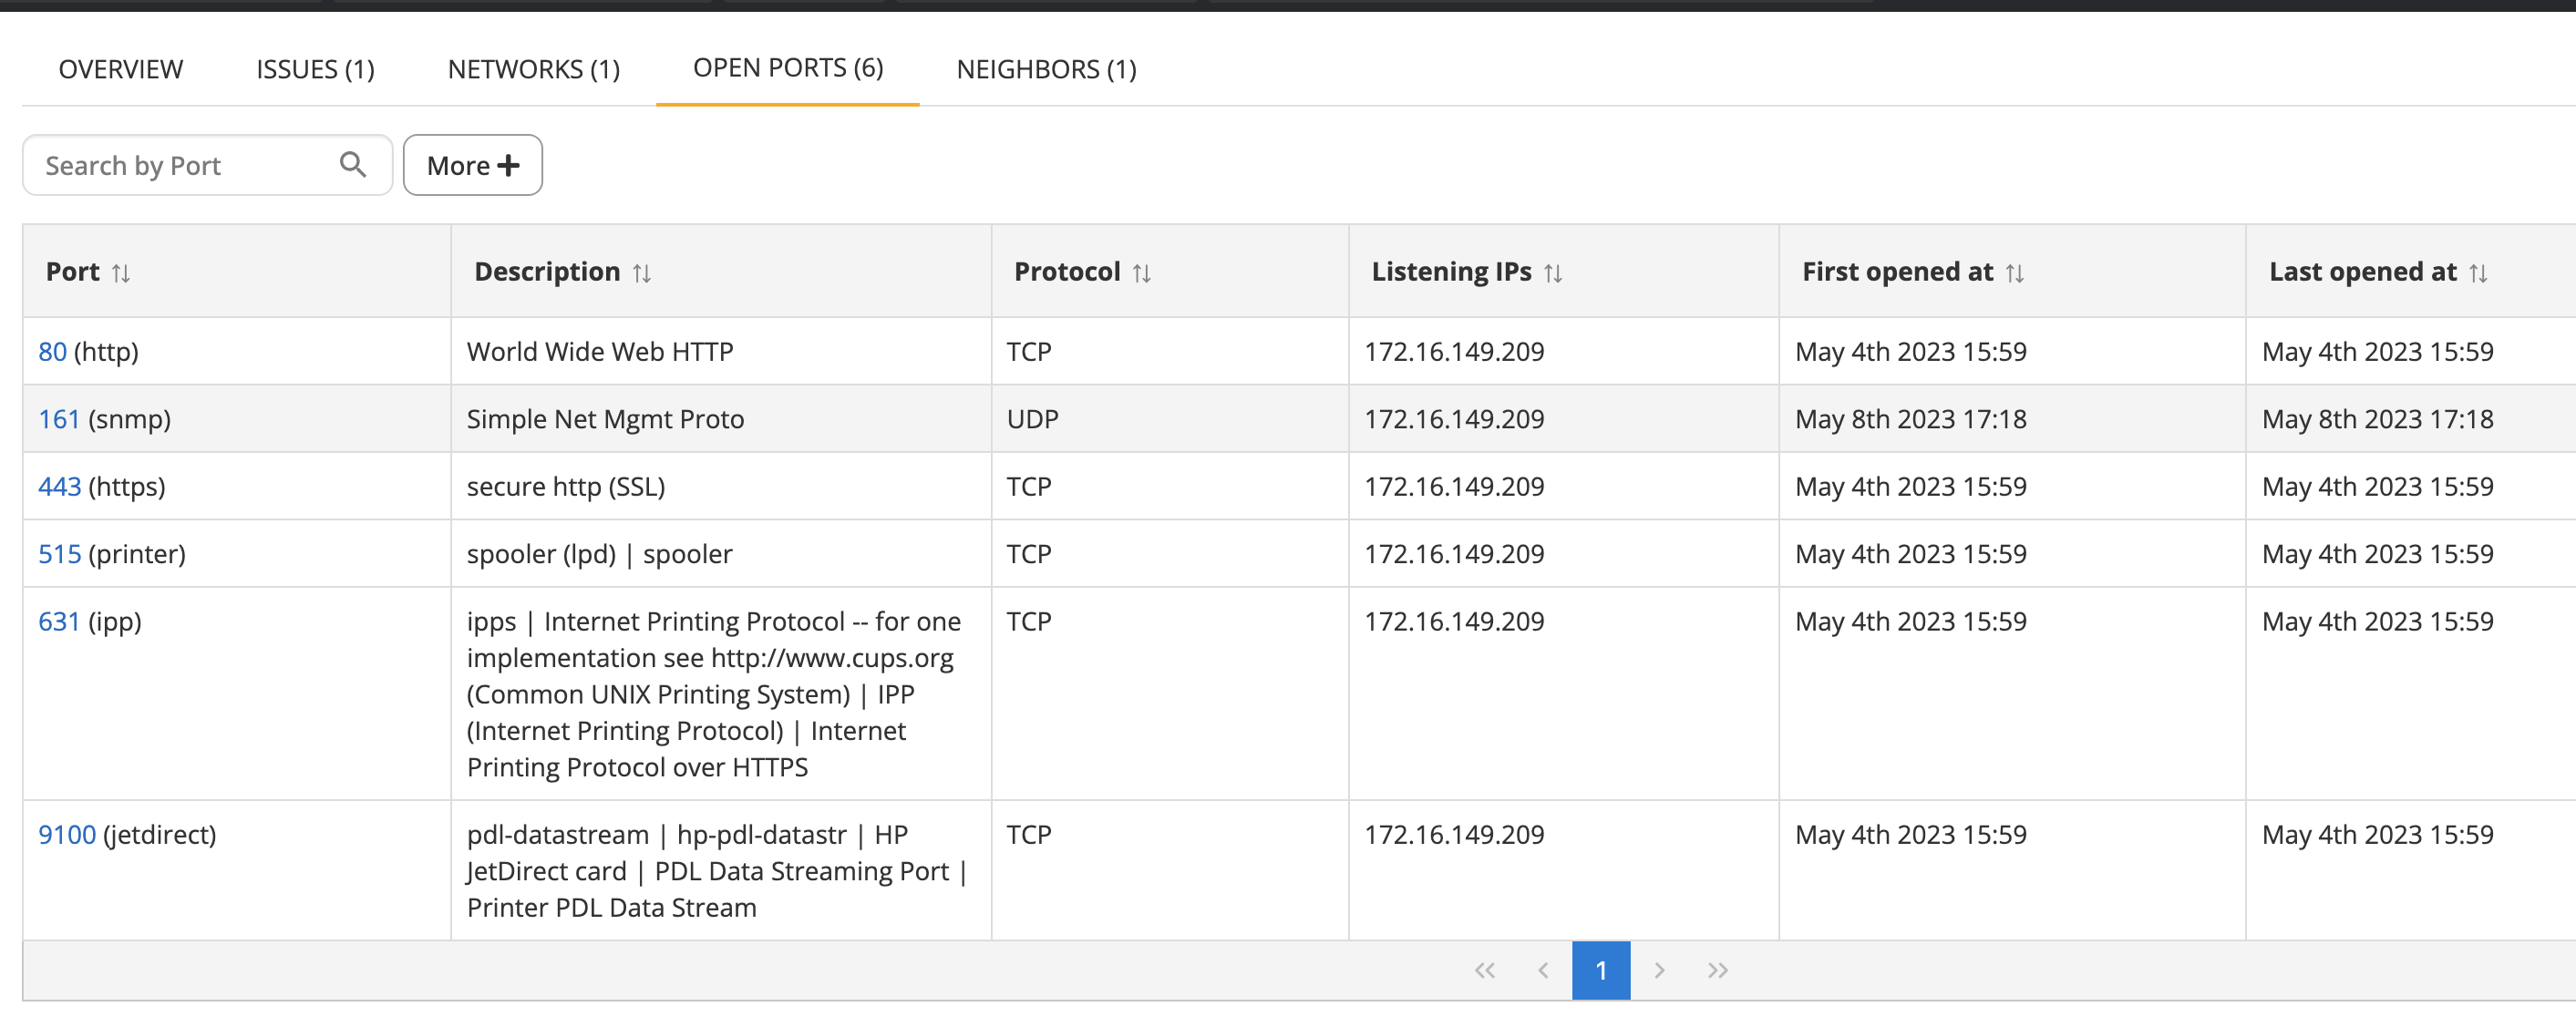
SNMP information will be shown there if available, while if open ports are found, the number will link to the Open ports tab. There, you can see information about the ports open on the asset and what well-known services use these ports:
In this case, the probe has told us that this device is likely a printer. Assuming we recognize the printer in question, we can confidently authorize the asset.
Inventory lists
The inventory lists provide detailed information about the inventory on the device. Each list is accessible by clicking on the corresponding tab. The information included in each inventory list is documented below.
Benchmarks
List of benchmarks that apply to the asset. Benchmarks are sets of configuration checks. If no benchmarks apply it may mean that the OS does not have a supported benchmark. For a full list of supported benchmarks see: https://kb.nanitor.net/BenchMarks/
The list shows the benchmarks that currently apply to the asset. For each benchmark, the following information is shown in the columns:
| Column | Description |
|---|---|
| Title | The title of the benchmark |
| Version | The version of the benchmark |
| Profile | The profile of the benchmark that is being used |
| Status | The current status of the benchmark: Active if being checked regularly. |
| Baseline Score | The current score of this asset for rules that are in Baseline (Technical Policy). |
| ISO27001 | The score for rules that are in ISO27001 compliance framework (note this is configurable based on what compliance framework is selected as the Primary framework). |
| Last Checkin At | The timestamp at which information for this benchmark on this asset was checked in last. |
Issues
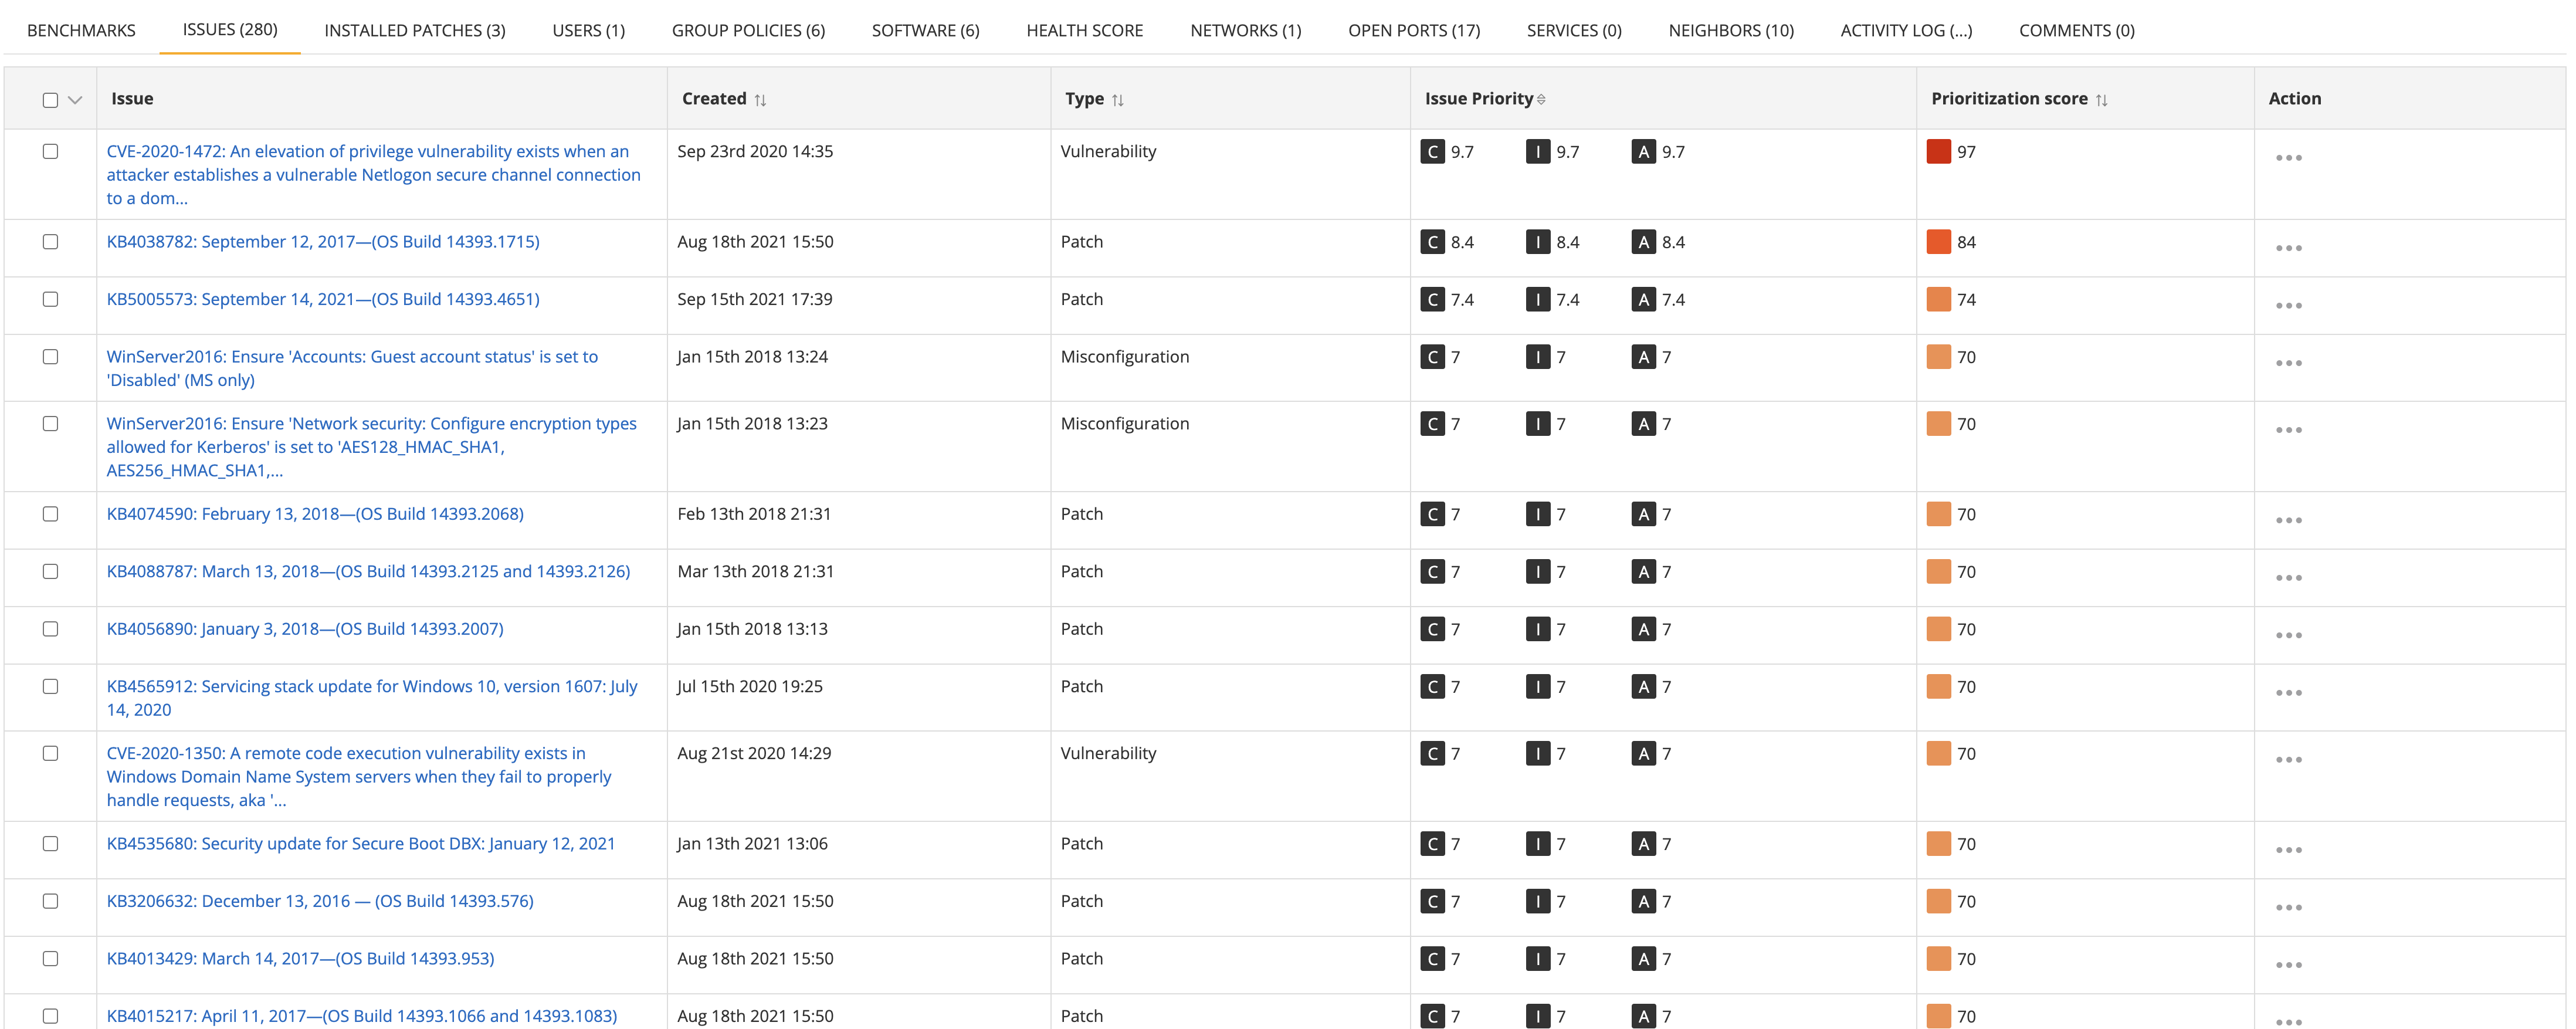
The Issues inventory list displays current issue violations for the given asset.
This table includes the following columns for each issue in the list
| Column | Description |
|---|---|
| Issue | Represents the issue name and links to the issue detail. |
| Created | The timestamp at which time the issue violation was created for the device. |
| Type | The type of the issue, e.g. misconfiguration, vulnerability, patch, software, user, pii. |
| Issue Priority | The priority of the issue in terms of confidentiality (C), integrity (I) and availability (A). |
| Prioritization score | The prioritization score of the issue, which is determined by multiplying the issue priority and asset priority and taking the highest component. |
| Action | Has an action "Assign issue" which allows assigning the issue to a remediation project. |
Note that older issues that have been resolved can be viewed by applying a resolved filter. Various other filters are available to identify sets of issues.
Installed patches
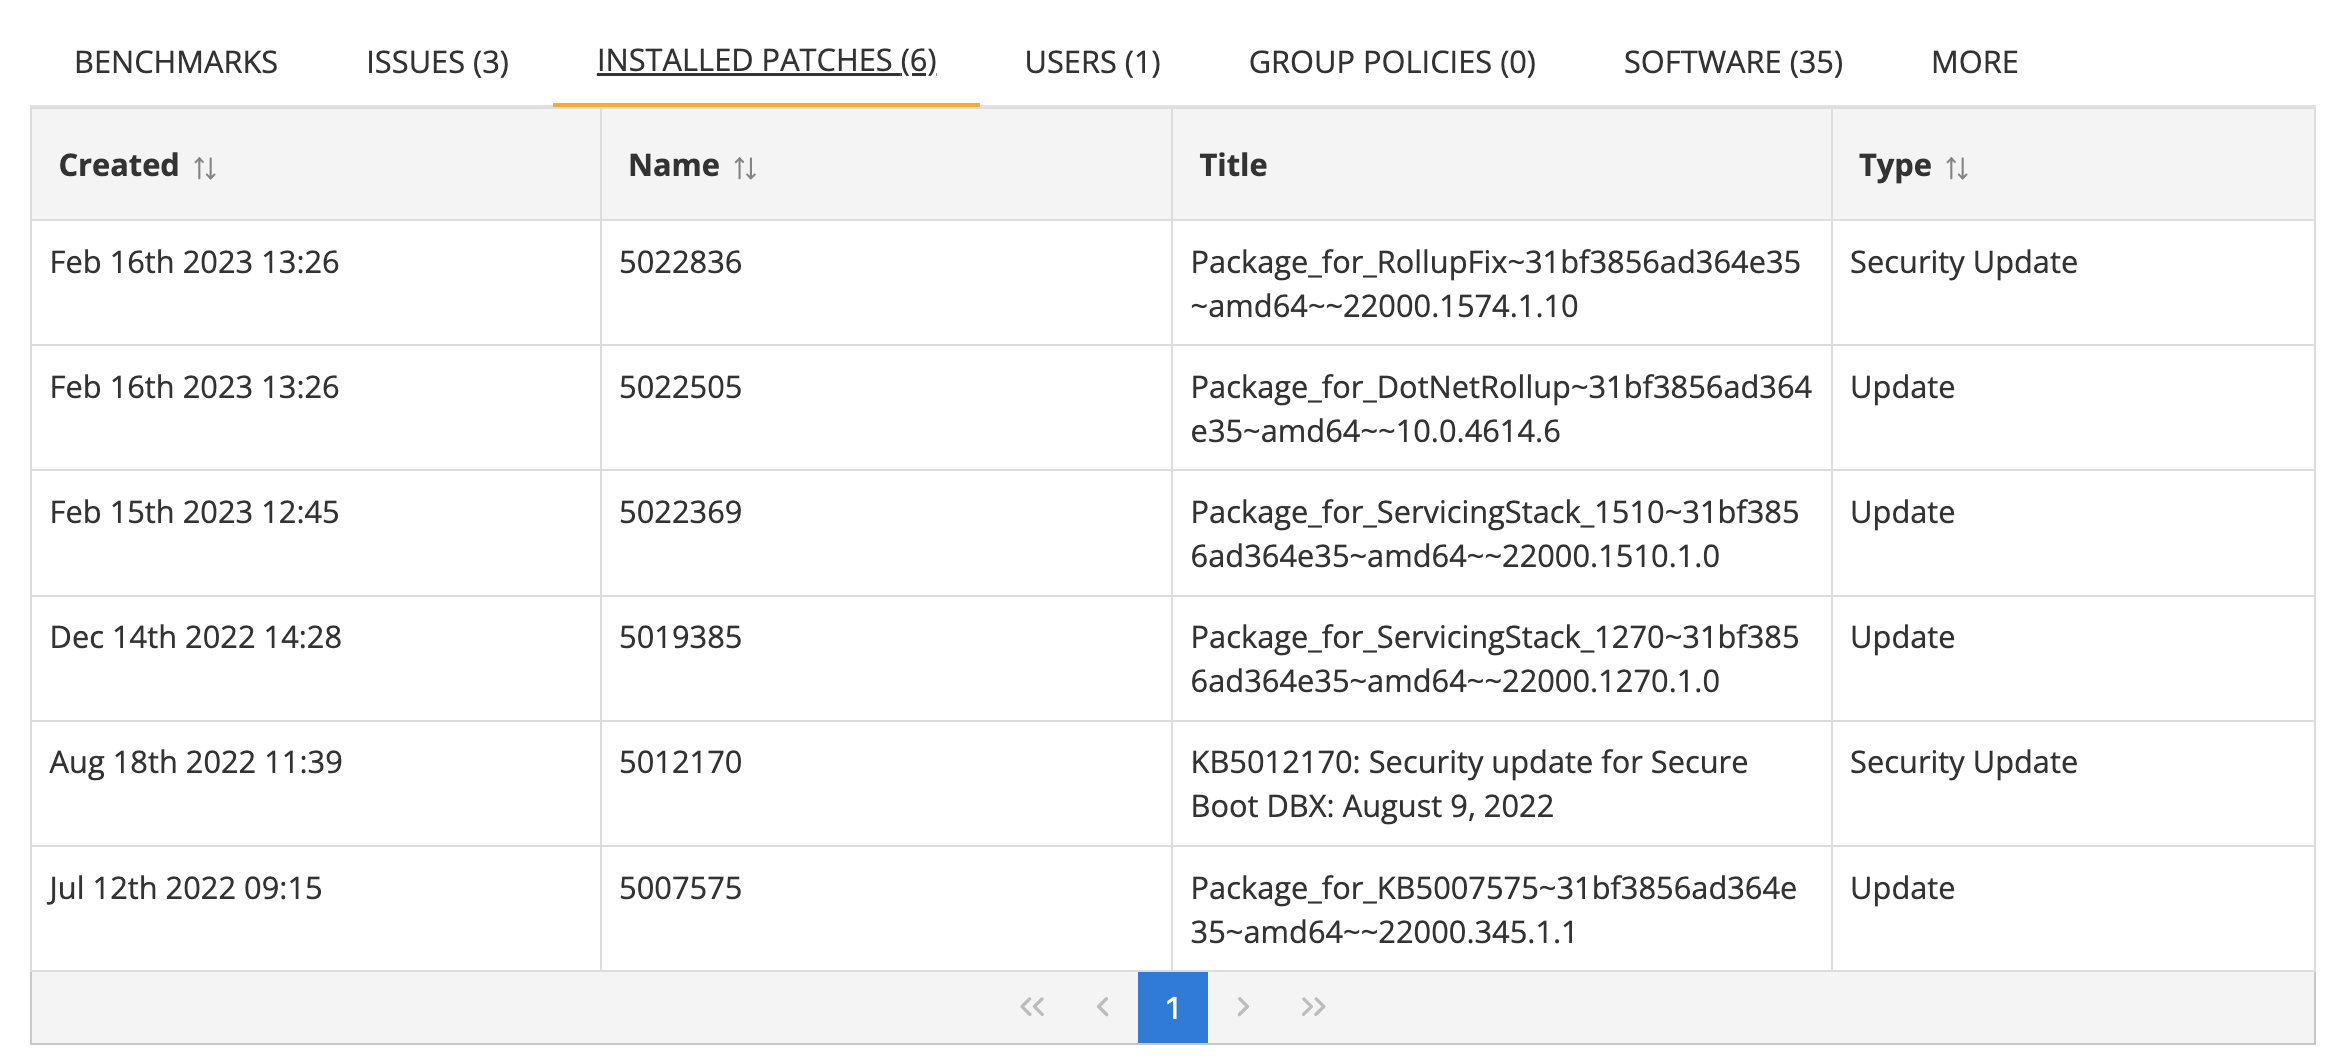
Shows a list of patches that have been installed on the asset. This is only supported on select operating systems where it is applicable.
This table includes the following columns for each patch in the list
| Column | Description |
|---|---|
| Created | The timestamp when the patch was first reported as being installed on the asset. |
| Name | The name or identifier of the patch. |
| Title | The title of the patch or the package name (Windows). |
| Type | The type of the update, e.g. "Security Update", "Update" |
Identities (Users)
Shows a list of identities (user profiles) on the asset. This includes information such as username, last login, and also an indication of whether the identity is currently logged on. This is a list of identities who have ever logged in and their access level at that time, not identities who currently have access.
The information included per user profile includes:
- Username the username of the profile used to log into the system.
- Name (full name description from Active Directory, or /etc/passwd, etc. depending on the system)
- Domain: The name of the domain (Windows only)
- Local Admin: "Yes" if the user can elevate to the local administrator (or root), "No" otherwise.
- Remote Allowed: "Yes" if the user can log remotely into the asset, "No" otherwise.
- Last Activity: The timestamp when the profile was last known to be active, as seen by the Nanitor agent.
- Last Logon: The timestamp when the profile was last seen with a user logged in, as seen by the Nanitor agent.
- Logged On Now: "Locally" if the user is currently logged in locally on the computer, "Remote" if the user is remotely logged in. The warning triangle indicates that the information may be old if the asset has not checked in recently.
Group policies (Windows only)
The Group policies inventory list displays group policies (sometimes called group policy objects or GPOs) that are active on the asset along with information such as application order, etc. Can be useful to debug why settings are not being applied correctly.
The information shown includes:
- Name is the name of the GPO.
- Applied Order represents the order in which the GPOs apply. This is useful for troubleshooting GPOs, and why a certain setting may or may not be applying correctly.
- Location describes the AD location where the group policy is linked.
Software
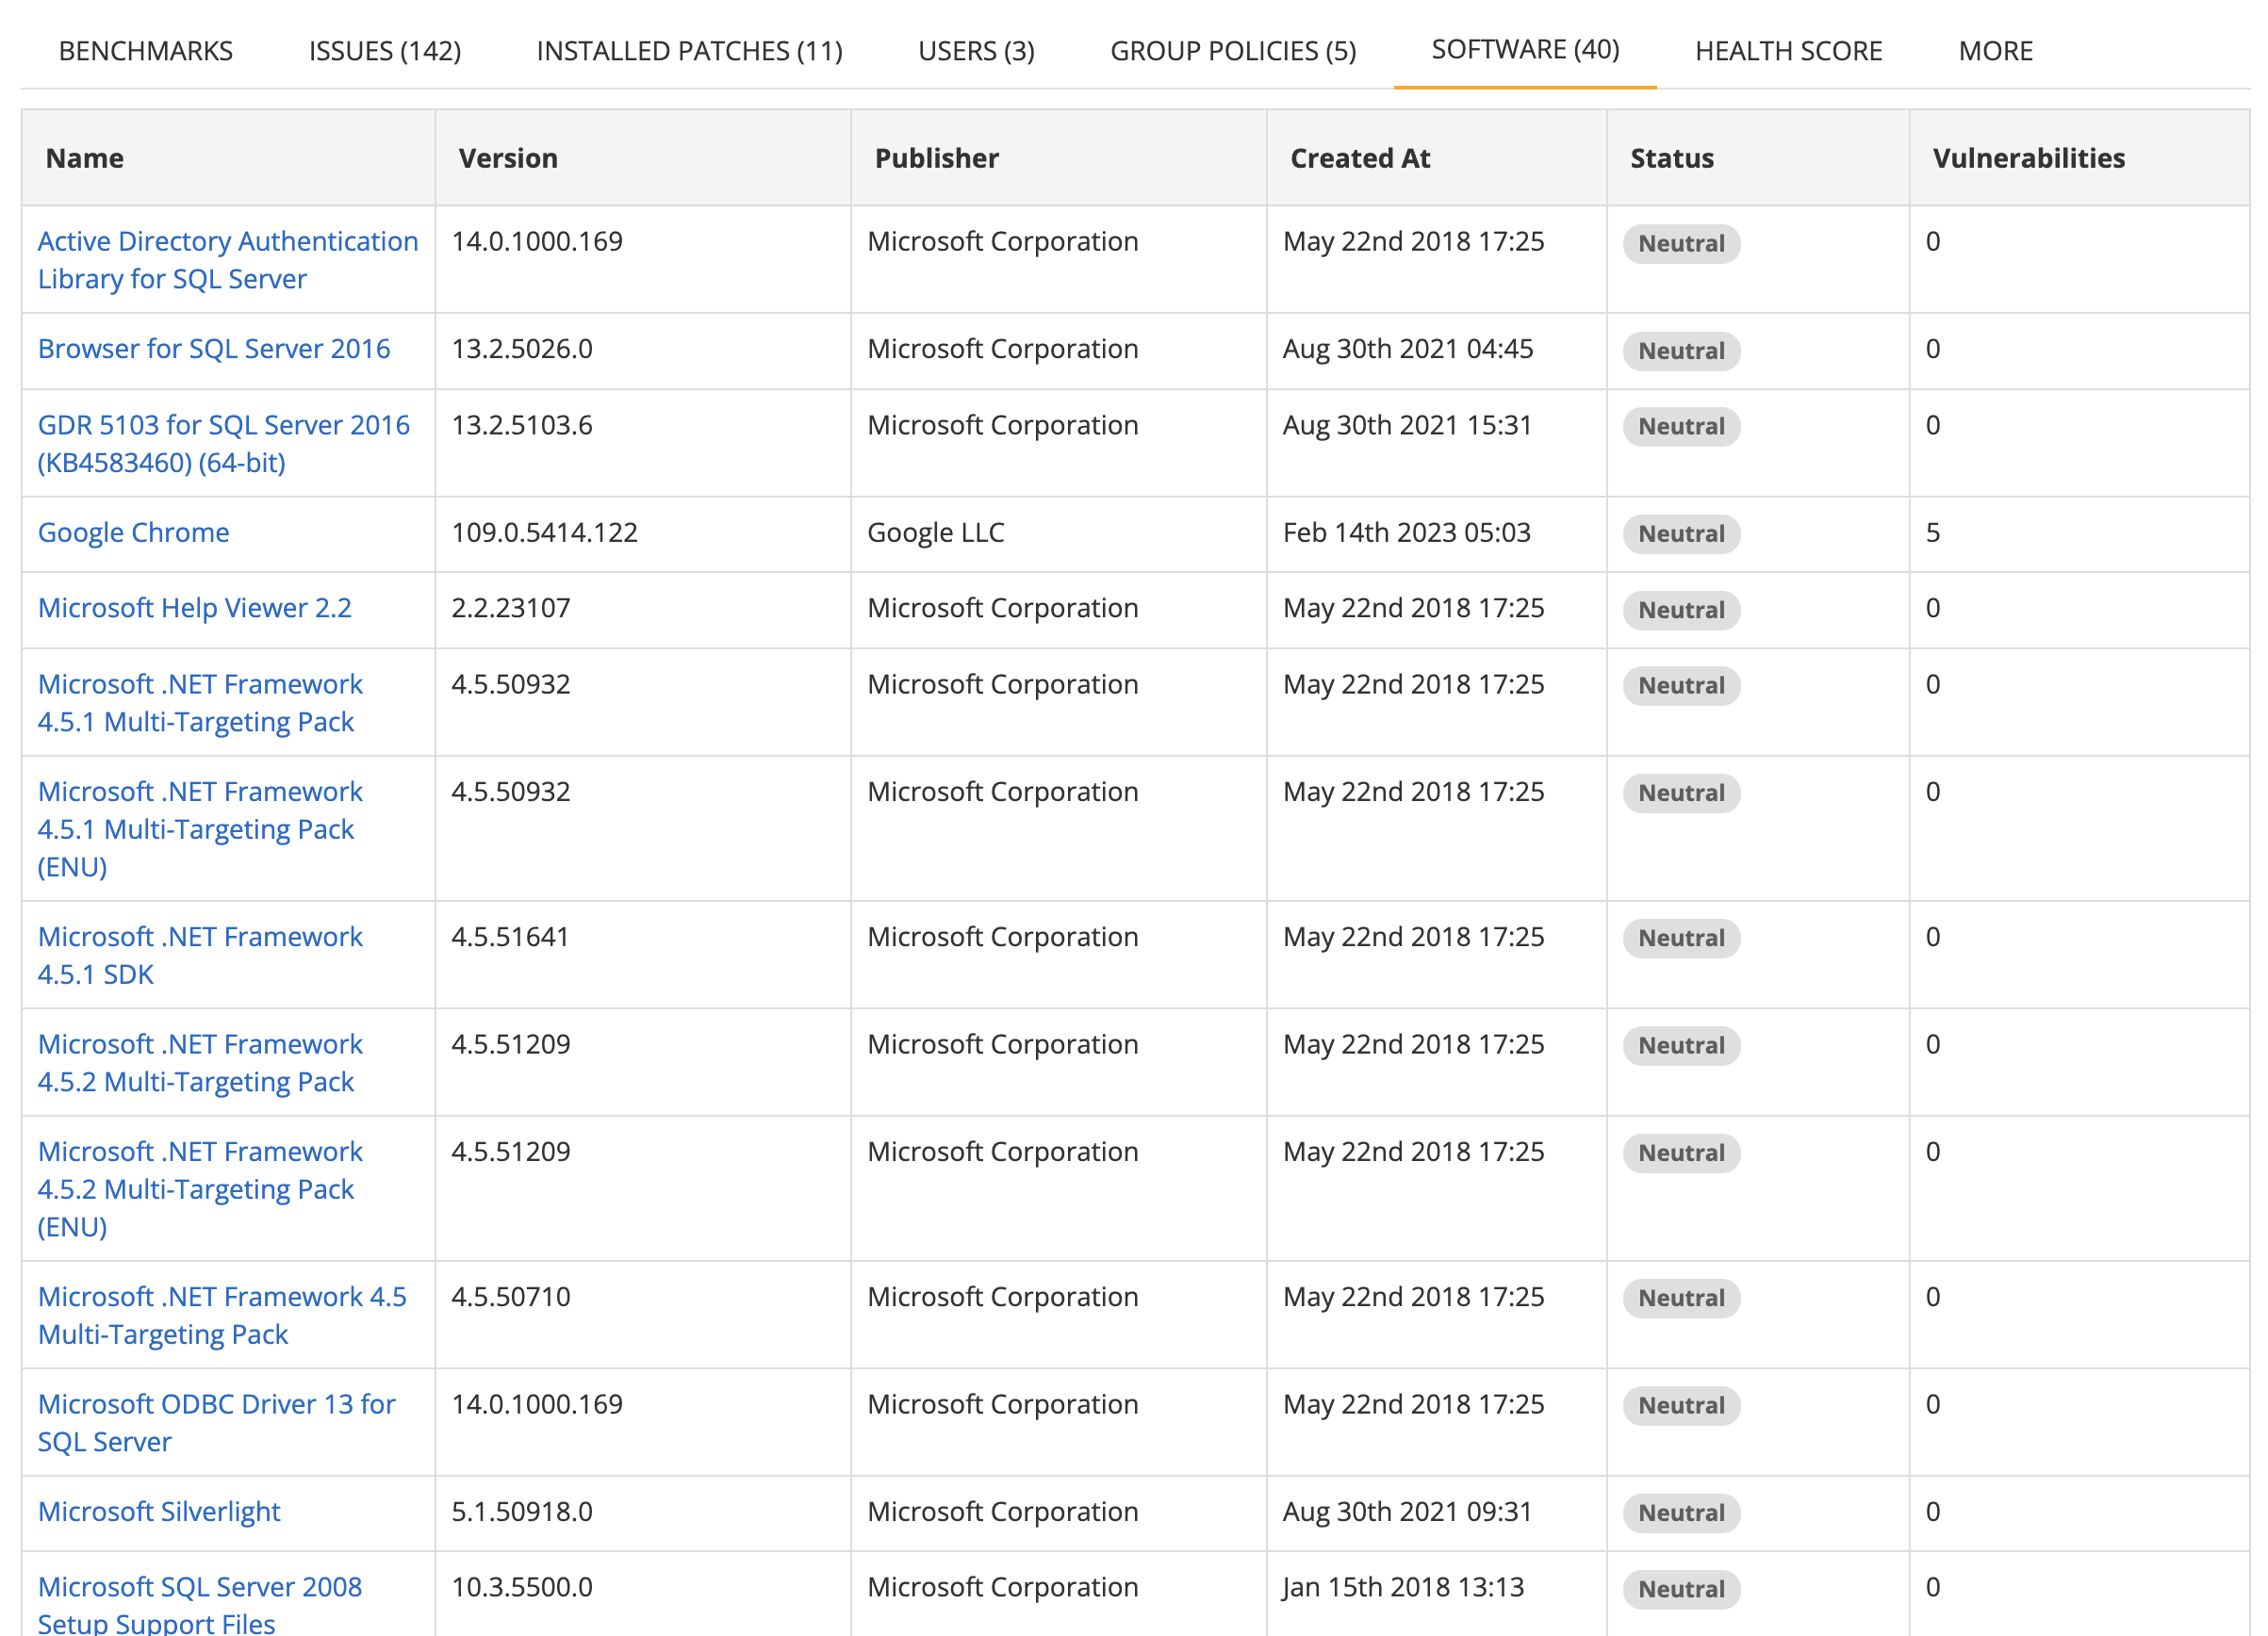
List of software installed on the device. This includes software detected through standard operating system inventories as well as Custom Software Checks that you have configured.
The fields shown are the
- Name (or display name) is the name of the software. This is typically the DisplayName of the software from the Windows Uninstall registry. For Custom Software Checks, this will be the name of the check you defined.
- Version (or display version) is the version of the software. For Custom Software Checks, this will be the custom version you specified when creating the check, or metadata from the detected item if no custom version was provided. If no version information is available, the value defaults to "custom version".
- Publisher is the vendor that produced the software, or if the information is not available it may indicate where it comes from. For Custom Software Checks, this will be "Custom" or the publisher name you specified.
- Source indicates where the software detection came from (e.g., "Windows Registry", "Custom Software Check"). Custom Software Check results are tagged with a visible source pill showing the check name.
- Created at indicates where the software was first seen.
- Status represents the compliance status of the software, i.e. whether it is blacklisted, whitelisted, mandatory or neutral (i.e. not with a classified compliance status).
Health Score
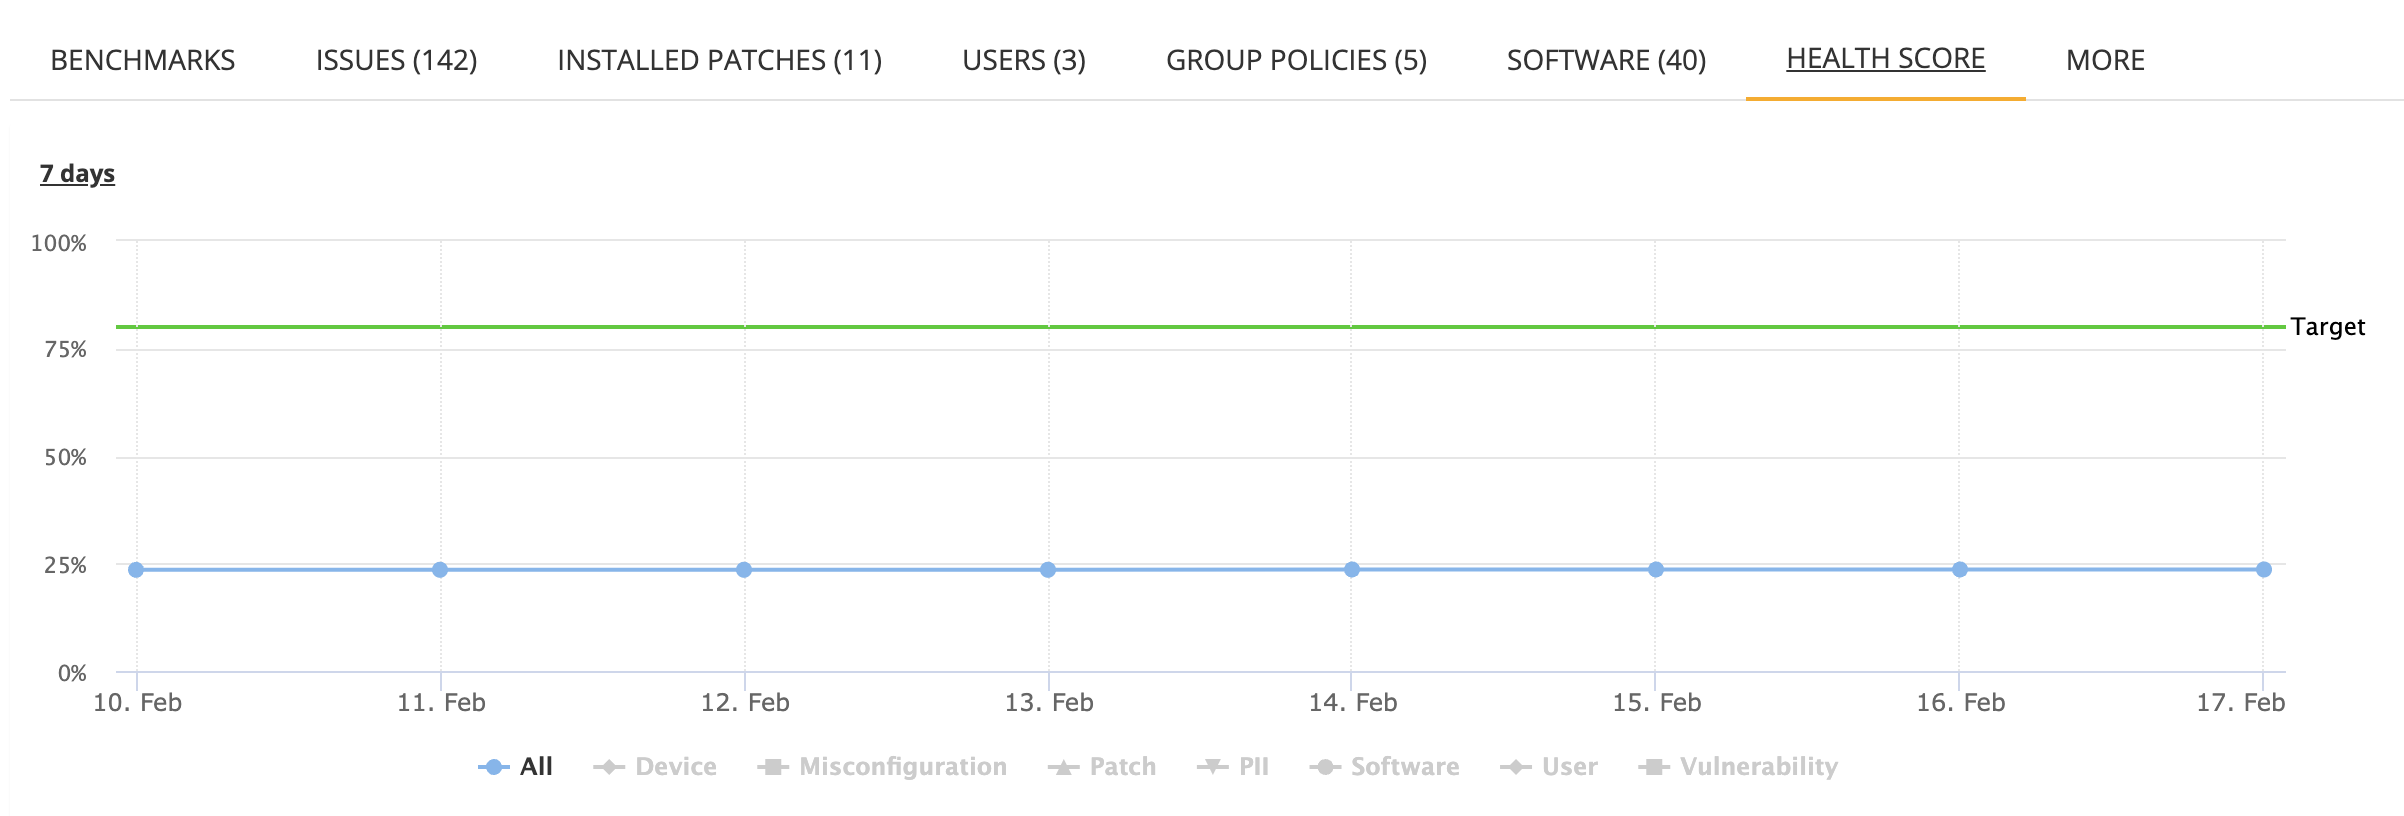
The trend of how the Asset Health has progressed over time.
It shows the target health score for the organization and the asset health score over time. In addition, the health scores for certain issue types individually can be seen by clicking on the issue type under the graph (not visible by default).
Networks
List of networks that the asset is on along with IP and hardware address information.
This information shows the network name, description (if provided for the network), IP and hardware (HW) address of the asset on the network.
Open ports
The open ports inventory list shows a list of open TCP ports on the asset.
The information per currently open port shown includes the following columns
- Port (and name)
- Description of what normally runs on this port
- Protocol (TCP / UDP)
- Listening IP addresses
- First opened at indicates when the port was first seen open on the asset
- Last opened at indicates when the port was last seen open on the asset
By default, only open ports are shown. But previously open ports can be seen by filtering on "Previously open ports" in the filter pane.
Services
List of running web services on the asset (if supported). On Linux assets, supported services include Nginx, Apache Tomcat, and Apache Httpd.
The information per running web service shown includes the following columns
| Column | Description |
|---|---|
| Type | The web service type, e.g. Tomcat, Nginx, HTTPD |
| Version | Version of the web service program |
| Details | More details such as installed location |
| Created at | Timestamp when the web service was first seen running |
| Last seen at | Timestamp when the web service was last seen running |
Neighbors
Neighbors are found through network discovery, where each asset that has network discovery capability can see other devices on the networks it is connected to.
List of neighbors seen on the network through network discovery. Note that the list shown is different depending on the asset type, for:
- Rogue asset - The list shows all the assets that have discovered/seen the given asset.
- Other asset types - The list shows all assets that have been seen by the given asset.
Thus when investigating and identifying what a rogue asset is, it can be useful to explore the neighbors and see what devices have been seeing the rogue asset.
The information for each active neighbor that the asset sees includes the following columns
| Column | Description |
|---|---|
| Hostname | Hostname of the neighbor |
| State | The state of the neighbor in Nanitor |
| Type | The asset type of the neighbor |
| Labels | Asset labels of the neighbor |
| OS | The operating system of the neighbor |
| First Discovered At | The timestamp when the neighbor was first discovered by the asset |
| Last Discovered At | The timestamp when the neighbor was last seen by the asset through network discovery |
Activity log
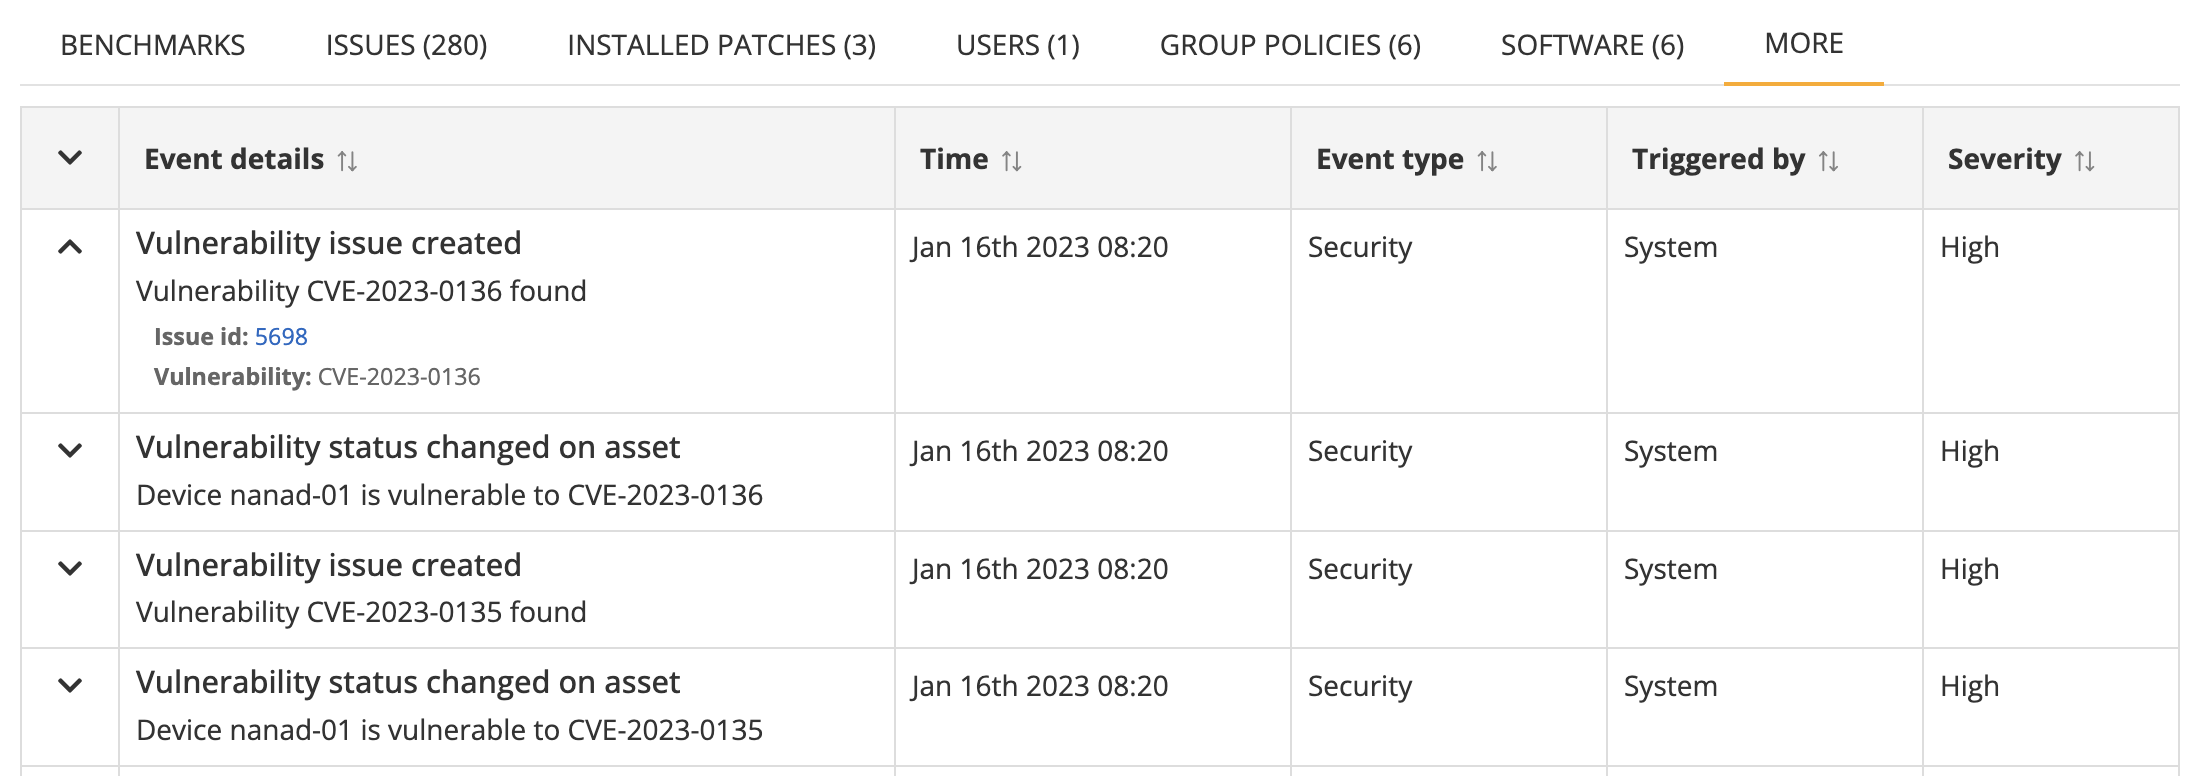
The activity log is an event history and audit log regarding events and changes that Nanitor logs regarding the asset. It includes both state changes on the asset, as well as user- and system-triggered changes.
List of all events that have been recorded for the asset since it was first added. The latest events are shown on top.
Note that additional information is available by expanding the event with the down arrow on the left.
The information for each event includes the following columns
| Column | |
|---|---|
| Expand/collapse arrow | Expands to show full information regarding the event. Collapse to reduce the row height and show less information. |
| Event details | The event message and field details (if expanded) |
| Time | Timestamp when the event was logged |
| Event type | The type of the event, e.g., Security or Audit |
| Triggered by | Event trigger, either System or User. User triggered changes are typically due to changes through the Nanitor UI, whereas system changes are due to automatic changes |
| Severity | The severity of the event: Low / Medium / High. |
Comments
The comments tab provides a list of comments that have been made regarding the asset. This provides a way to discuss an asset, for example, if something is surprising or needs to be looked at.
Each comment has a timestamp, and the comments are shown ordered by time (newest first). Each comment can also be resolved, for example, if the information no longer applies. This is done by selecting the action menu on the comment (three dots) and selecting "Mark resolved".
Projects
The projects tab provides a list of projects to which the asset has been added.
The information for each project includes the following columns:
| Column | |
|---|---|
| Name | The project name. Click it to get more information on the project. |
| Satus | The project status, e.g., Backlog, In progress, or Done. |
| Assignee | The organization user responsible for the project. |
| Due date | The project due date, if any. |


