Activity Log report
The Activity Log Report shows a chronological list of all the tracked activities and changes that have taken place within Nanitor. This report can help organizations keep track of changes made to their security policies, user accounts, and devices, as well as monitor for any suspicious or unauthorized activity.
The report is presented as a table that lists all events and includes details such as the time of the event, event type (security or audit), who triggered the event (system or user), the severity level (low, medium, high), the hostname of the asset involved (if applicable), and the IP address of the asset or user that triggered the event.
The Activity Log report can be filtered to show activity for a specific asset or group of assets by selecting an asset label or searching for a given hostname. The report also provides information on user activity, such as login times and actions taken within Nanitor.
In addition, the report can be filtered by severity level, making it easy to prioritize high-risk events. The report can be exported in CSV format for sharing with other stakeholders.
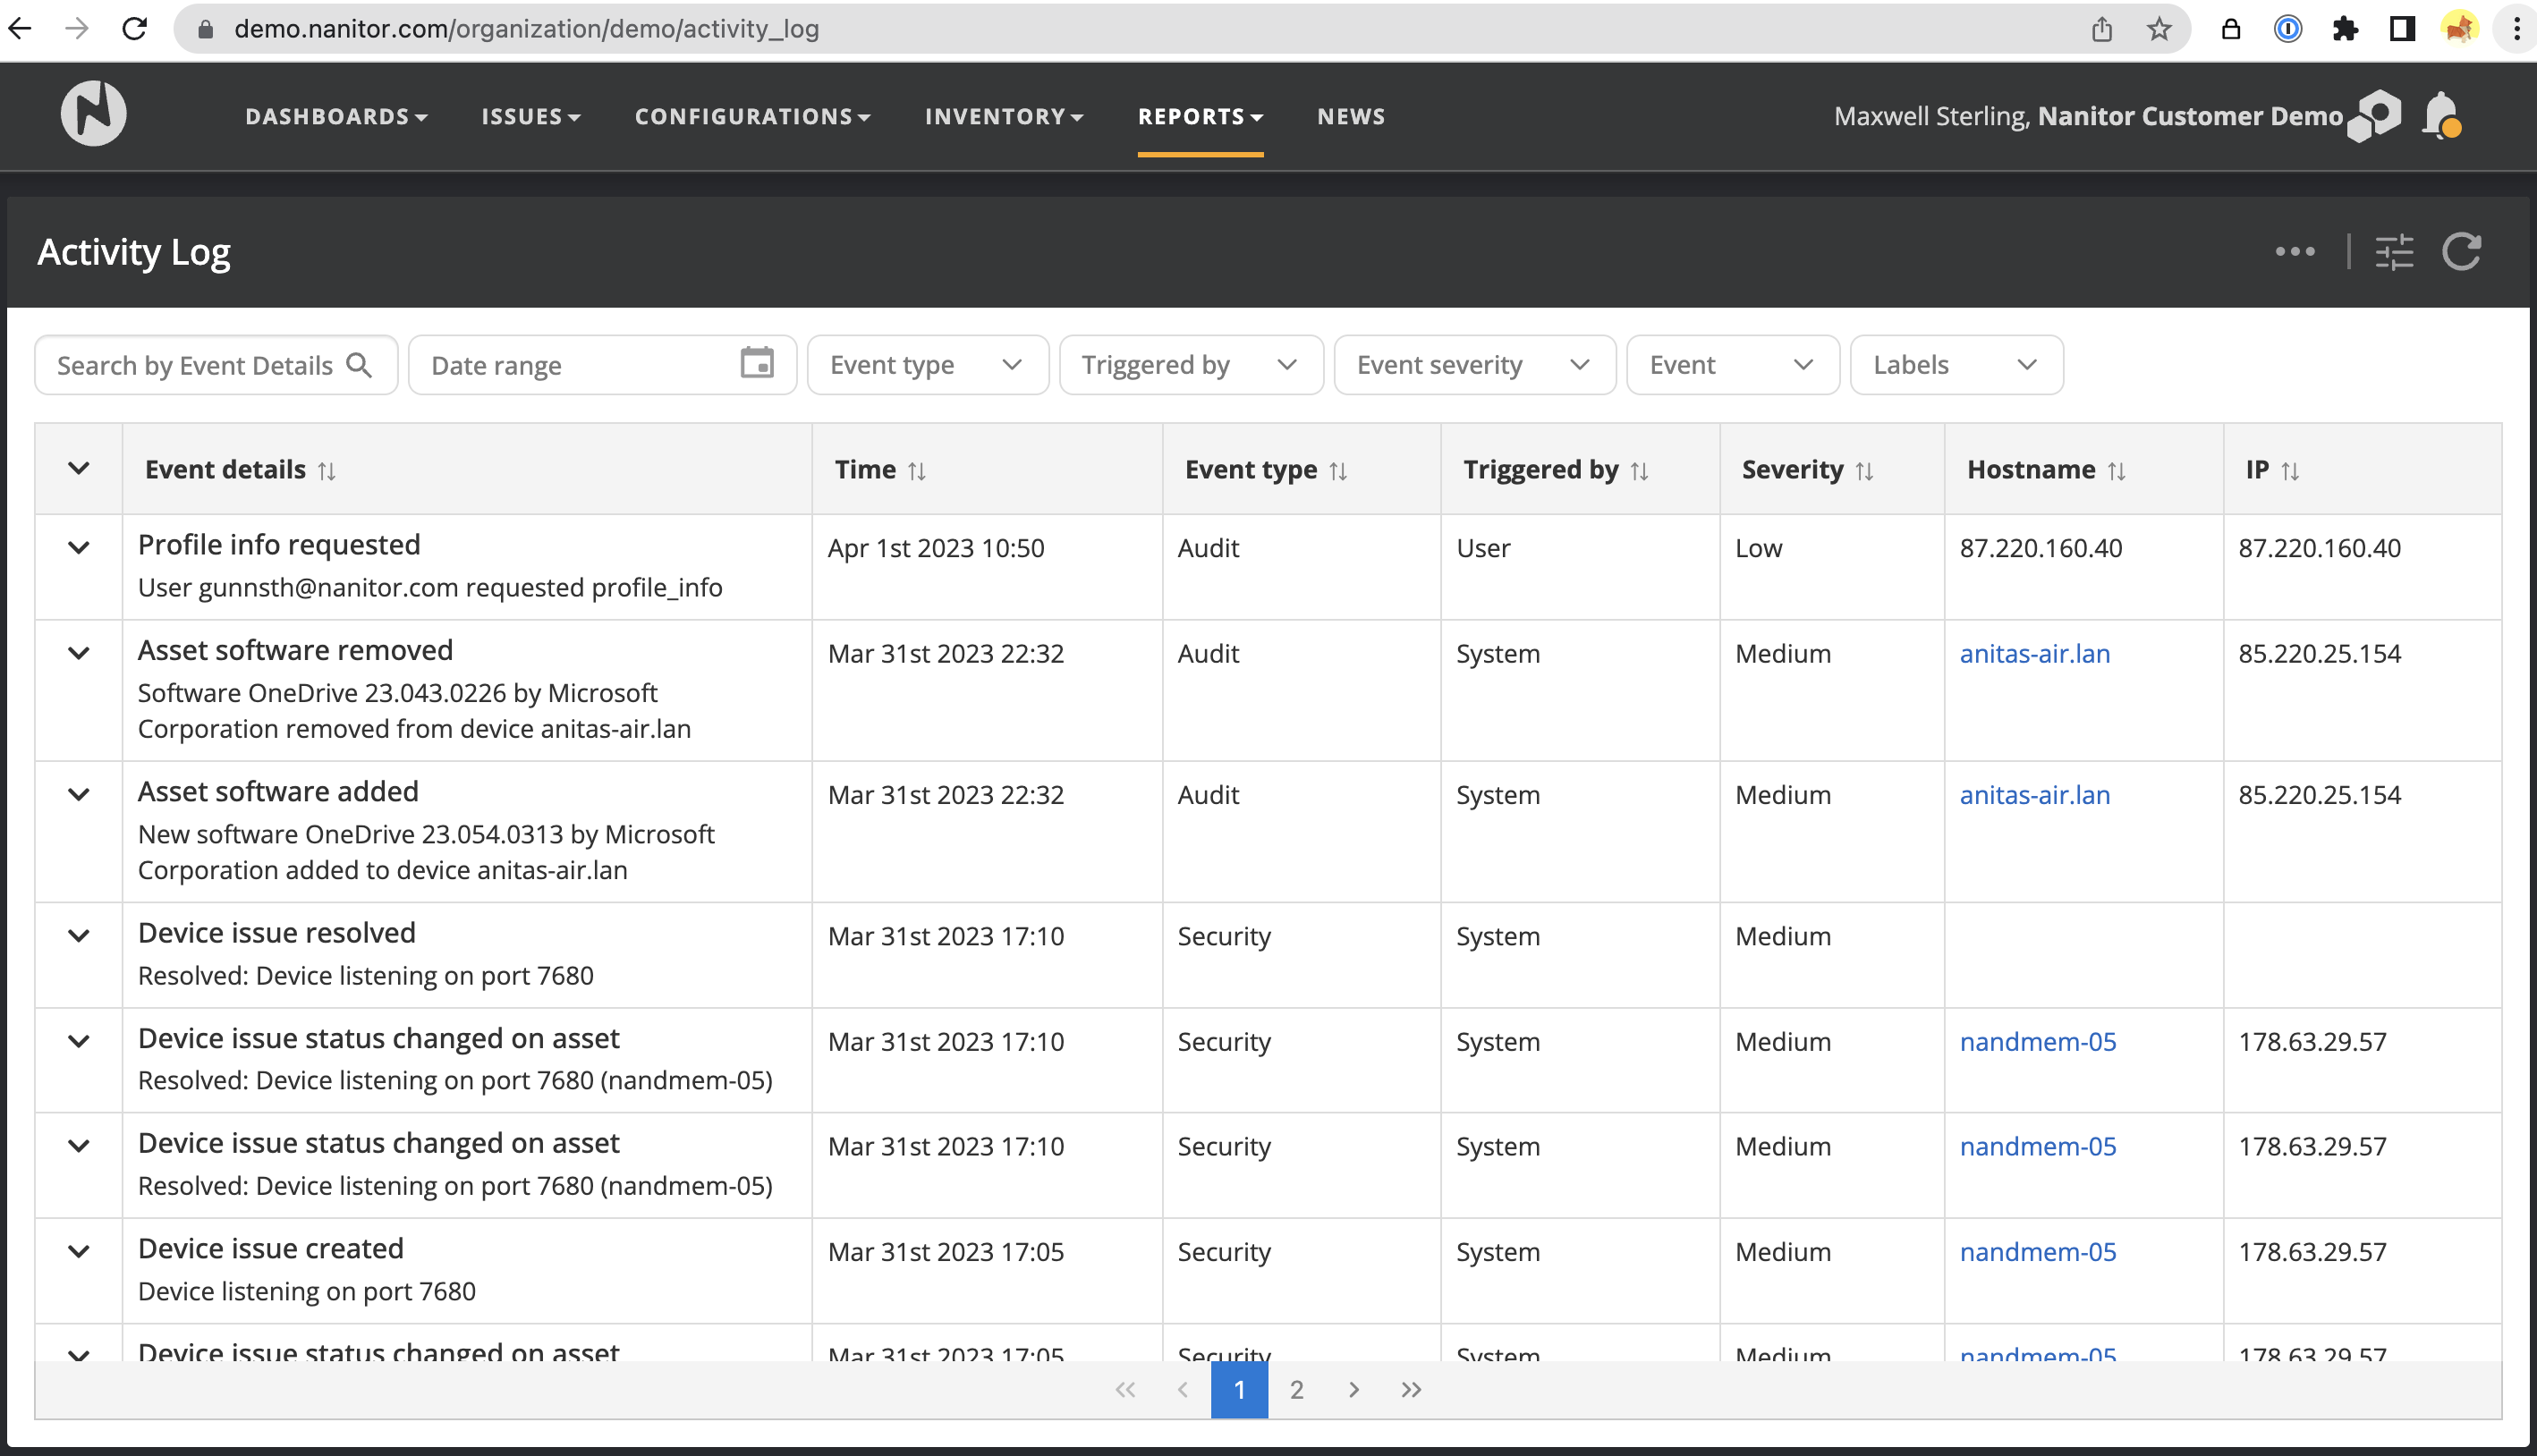
The report is presented as a list of events. Each event is represented as a row and has multiple columns.
Columns:
- Event details: Description of the event. Can be expanded to see more information in terms of key-value pairs.
- Time: The date and time when the event was recorded.
- Event type: The event type can be either "Audit" or "Security". Audit events are related to compliance-related changes, whereas "security" events are related to events that are relevant to security posture and health.
- Triggered by: Can be either "System" or "User". System-triggered events are any events that were automatically generated by Nanitor or devices causing changes, whereas user-triggered events are related to user actions in the Nanitor UI, such as changes in settings, issue exceptions, user logins, label creation, etc.
- Severity: Each event can have a severity of low/medium or high. The severity reflects the relevance of the event in terms of security posture. Low events can be considered informative, whereas medium and high may indicate changes affecting security posture and health.
- Hostname: Hostname of device involved in the event (if applicable). Can be empty. For user-triggered events, this will typically be the IP of the user that connected to the Nanitor UI.
- IP: The IP address involved. Typically IP address of the device involved if any, or the IP of the user connecting to Nanitor.
Filters:
Most of the columns can be filtered. In addition, there are filters for the following:
- Date range: Can specify a period to audit events for a specified date range. This can be useful for audits.
- Asset labels: The audit report can be limited to specific asset labels. This can be useful for teams to consider only events from assets under their management.
Actions:
- Export: Exports the report in CSV format. The export is based on the current filters applied.
Customize view:
- Customize columns: Allows selecting columns and reordering as desired.
- Expanded view: By default, each row is shown in unexpanded mode. In expanded mode, more detail is shown about each event in the form of key/value pairs. If selected, all rows will be expanded by default.